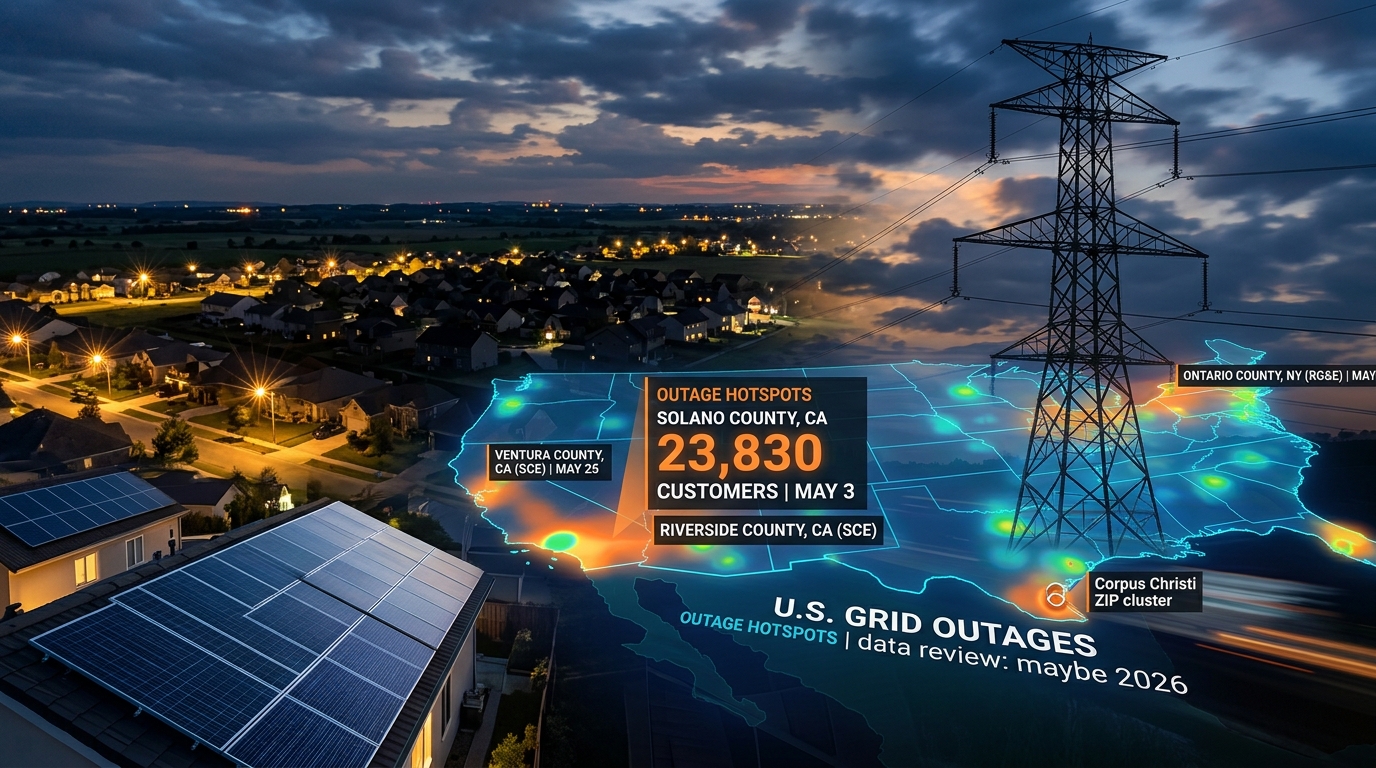
Solano County, California lost 23,830 Pacific Gas & Electric customers in a single event on May 3 — the most customers hit by any U.S. outage in May 2026. Southern California Edison spent the month restoring big ones of its own: 11,232 customers in Ventura County on May 25, a cluster of 9,200-customer events in Riverside County on May 2, and 8,968 in Los Angeles County on May 8.
A substation transformer failure in Ontario County, New York took out 11,407 Rochester Gas & Electric customers on May 26. Baltimore County, Maryland logged an outage on every single day of the month, and led the country in animal-caused outages while it was at it.
Which states had the most power outages in May 2026?
Massachusetts, New Jersey, and Maryland topped the country for outage density over the past 30 days, with Massachusetts averaging 774 outage events per county across its 14 counties.
| State | Events | Counties Hit | Events per County |
|---|---|---|---|
| Massachusetts | 10,842 | 14 | 774 |
| New Jersey | 15,326 | 21 | 730 |
| Maryland | 10,845 | 15 | 723 |
| Connecticut | 4,752 | 10 | 475 |
| Alabama | 28,458 | 60 | 474 |
| Texas | 96,247 | 225 | 428 |
| California | 23,058 | 57 | 405 |
Texas had the largest raw count by a wide margin: 96,247 events across 225 counties. Its size pulls the per-county density below the Northeast corridor, where the same story keeps repeating — small, dense states where every county gets hit. The density-versus-volume tradeoff is the core decision in picking a sales territory.
New Jersey's number is JCP&L and PSE&G splitting the state. Massachusetts is National Grid and Eversource territory.
Which counties had the most outages last month?
Harris County, Texas led the country with 17,743 outage events across four reporting utilities. Jefferson County, Alabama (Birmingham) was second at 5,406 from Alabama Power alone.
| County | State | Events | Utilities |
|---|---|---|---|
| Harris | Texas | 17,743 | 4 |
| Jefferson | Alabama | 5,406 | 1 |
| Tarrant | Texas | 4,499 | 2 |
| Nueces | Texas | 4,265 | 1 |
| Jackson | Missouri | 4,254 | 2 |
| Bexar | Texas | 4,014 | 2 |
| Montgomery | Texas | 3,920 | 6 |
| Dallas | Texas | 3,687 | 1 |
| Fort Bend | Texas | 3,485 | 2 |
| Salt Lake | Utah | 2,973 | 2 |
The one to watch is Nueces County — Corpus Christi. 4,265 events from a single utility (AEP Texas) puts it fourth in the country, ahead of Bexar and Dallas, counties with five times its population or more. The ZIP-level breakdown below shows where inside the county those events landed.
The chronic list runs long: counties with at least one outage on every day of the month. Baltimore County, Maryland led again with 3,741 events across 31 days. Anne Arundel County, Maryland: 1,333 events, 31 days. Alameda County, California: 1,243. Bell County, Texas: 1,168. Allegheny County, Pennsylvania: 1,023. The 12-month version of that leaderboard shows which of these are permanent residents.
What were the biggest single power outages in May 2026?
The largest single May 2026 outage was Pacific Gas & Electric's May 3 event in Solano County, California, which knocked out 23,830 customers. Power was back in about 90 minutes, and no cause was published.
The rest of May's biggest events, ranked by customers hit:
- May 7, Northampton County, Pennsylvania. Met-Ed, 17,489 customers. No cause given.
- May 9, Contra Costa County, California. PG&E, 12,216 customers out for 14.3 hours. Cause: broken underground equipment.
- May 26, Ontario County, New York. Rochester Gas & Electric, 11,407 customers. Cause: substation transformer failure.
- May 25, Ventura County, California. Southern California Edison, 11,232 customers, restorations running 8 to 14 hours. Logged as "Equipment Problems."
- May 7, Honolulu, Hawaii. Hawaiian Electric, 9,646 customers.
- May 2, Riverside County, California. SCE logged a string of near-simultaneous events around 9,220 customers each, with restorations from 8 to 19 hours. All of them sat in "Analyzing Problem" status throughout.
Equipment is the through-line. Broken underground equipment in Contra Costa, a failed substation transformer in Ontario County, "Equipment Problems" in Ventura. None of May's biggest events came with a storm attached — the hardware just gave out.
Which ZIP codes had the most power outage activity in May 2026?
ZIP 77535 in Liberty County, Texas — the Dayton area, northeast of Houston — logged 805 outage events in 30 days, the most of any ZIP in the country.
The bigger pattern is the Texas Gulf Coast. Five Corpus Christi ZIPs sit in the national top 25:
- 78415 — 738 events
- 78418 — 579 events (Flour Bluff, Padre Island gateway)
- 78411 — 384 events
- 78412 — 355 events
- 78413 — 317 events
That's 2,373 events across five adjacent ZIPs, all AEP Texas territory. Add 78382 in Rockport (528 events), 78332 in Alice (372), 78102 in Beeville (346), and 78566 in Cameron County (321), and the South Texas coastal corridor is the densest outage cluster in the country at ZIP level.
Outside Texas, 36207 and 36201 in Calhoun County, Alabama (Anniston) combined for 835 events, and 70466 and 70454 in Tangipahoa Parish, Louisiana combined for 671.
These counts come from binning each geolocated event to the ZIP its coordinates fall inside, which is what makes ZIP-level data worth pulling — the county number hides this much variation. For the history under any specific ZIP, see how to find power outages by ZIP.
What caused the May 2026 outages?
Most May outages had no public cause. "Pending Investigation" alone covered 33,443 events, and the full family of "Under Investigation," "Currently Assessing," "Unidentified," and blank labels adds tens of thousands more. Why utilities don't explain outages covers how routine this is.
Of the events that did get a cause:
- Equipment failure led on volume: "Equipment issue detected" (3,731 events), "Upgrading Equipment" (2,951 at 9.1 hours average), plus the usual long tail of equipment labels. In Texas, a single "Equipment Issue" label accounted for 296,000 customer interruptions on its own.
- Weather was steady: "Inclement Weather" (3,588 events), "Storm Damage" (2,697 at 7.6 hours average), "Weather Related" (2,117 averaging 82 customers per event).
- Tree contact logged 2,317 events at 7.2 hours average — fewer events than weather, but consistently among the slowest to fix.
- Planned work added roughly 19,000 events across the various maintenance labels. Filter these out when looking for pain; nobody buys a battery over an outage they got a postcard about.
What were the strangest outage causes in May 2026?
Cars hit utility poles more than 1,000 times in the past 30 days. The vehicle-accident labels combined for over 1,050 events averaging around 100 customers each, and one utility's "CAR POLE" label averaged 356 customers per event with a peak of 3,856.
Animals took the grid down about 2,900 times. The most damaging label was "Animal in Equipment": only 38 events, but averaging 619 customers and 11.1 hours each. Baltimore County, Maryland led the country in animal-caused outages with 105 events — the same county that logged an outage on every day of May. The squirrels are not helping.
The rest of May's odd-cause ledger:
- Lightning. Roughly 700 events at about 8 hours average restoration.
- Pole fires. 98 events at 12.1 hours average, the slowest fix in this list. We covered why pole fires take so long to restore in a dedicated post.
- Dig-ins. 86 events of someone putting a shovel or excavator through a buried line.
- Wildfire de-energizations. 24 preemptive shutoffs averaging 238 customers each.
If you like this genre, the strangest outage causes in the data goes much deeper — balloons included.
How should installers use May's data going into June?
June 1 was the start of Atlantic hurricane season, and May's hottest ZIP cluster sits directly on the Texas Gulf Coast. Corpus Christi, Rockport, and the Rio Grande Valley counties (Cameron at 1,675 events, Hidalgo at 2,044) just showed what their grid does in a quiet month. Homeowners there know what June through November looks like, which makes backup power the easiest conversation of the year.
The chronic counties are the other standing play. Baltimore, Anne Arundel, Alameda, Bell, and Allegheny logged outages every single day of May — every week of June gives an installer in those counties a fresh reason to knock. How to pitch after an outage covers the door conversation, and last month's edition has the April baseline for these same counties.
If you want the ZIP-level cut for your own state and counties, grab a free grid profile. Pick up to three counties and we'll send the outage history at the ZIP level so you can build your canvassing routes around it.