For solar, battery & generator installers

Stop knocking random doors.

Every Monday: the streets that just lost power. Knock those.
The pain is fresh.

Every Monday a fresh target list
House numbers not just ZIPs
3,100+ counties tracked

Monday morning. Where do you send the reps?

Most teams guess. Same ZIPs as last month. Every wrong street burns paid hours on cold doors.

Our answer: the streets where the power just went out. In your inbox before the trucks roll.

Knock with the story already in hand

“Hey, we heard Pacific Power had an outage around here last Friday afternoon. A tree took down a line. Did you folks get hit?”

The opener writes itself. The pain is still fresh.

Know which streets to knock

California power outage map by ZIP code
1

Tell us your counties

Pick a state and up to 3 counties. That's the setup.

New Jersey power outage map by ZIP code
2

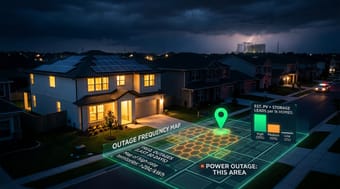
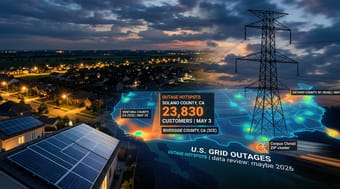
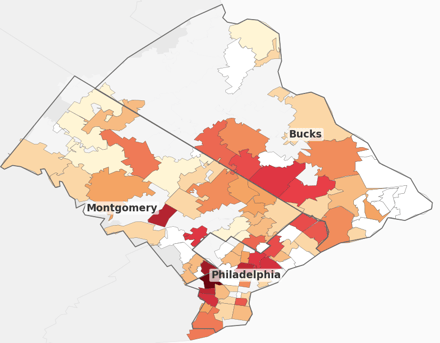
We find the streets that lost power

We watch every utility, around the clock. Every outage gets broken down to the streets that went dark, house numbers included.

Pennsylvania power outage map by ZIP code
3

You knock the right doors

Every Monday: a ranked street list. Hardest-hit blocks on top. Your route plans itself.

Four files. Every Monday. Broken down to the street.

Two ways to get the doors

The streets report is a subscription.
Canvassing leads are separate, priced per door.

The subscription

Sample streets CSV showing each affected street with ZIP, home-hours impact, repeat-victim flag, cause history, single-family percentage, and median home value

You plan the routes

$149/mo flat · every street included

All four files, every Monday. Build call lists, ad zones, mail routes. Up to 3 counties.

Get the weekly report →

Separate product

Sample canvassing brief PDF page showing a street-level map of a canvassing zone with numbered pins and door cards carrying the owner name, address, outage cause, local outage window, utility, and property profile

We plan the routes

Pay per door · no subscription needed

Named owners, clustered into walking routes. Knock-ready. Open a real delivery: 241 Oregon homes, owners masked.

See canvassing leads →

Built on federal and utility data

Every data point traces to a federal or utility source.

DOE
EAGLE-I & ODIN Grid disturbance archive (2014–present) + continuously updated utility-reported disturbances
EIA
EIA-861 Utility service territories and customer counts
Census
ACS B25024 Single-family household % by ZIP
OA
OpenAddresses Public dataset of streets and house numbers, used to name the affected addresses

See the streets in your territory

Pick your state and up to 3 counties. We'll email you the streets that lost power, ranked, plus the ZIP demographics.

Sample of recent events

Installers often ask

How do I find power outages by ZIP code?

There's no single public source. Utility outage maps only show what's out right now and disappear once power is restored. Federal datasets like the DOE's ODIN feed and the EAGLE-I archive publish history, but report at the county level, and one county typically spans 50 to 200 ZIPs, averaging neighborhoods together.

GridProfile assembles ZIP-level event records from direct utility feeds and federal data, then emails the breakdown for any U.S. territory. See the full walkthrough of public outage data sources →

Did the homeowner actually lose power?

We report what the utility reported, not what the meter saw. When a utility reports an outage with a known service area, GridProfile breaks it down to the streets inside that area, but the grid sometimes reroutes power around the failure, so a specific home on an affected street may or may not have lost power for the full duration the utility reported.

That matters for your outreach script: "I saw your block on Marketplace Ln was on the outage report three times this month" is true and grounded. "You lost power three times" is a step further than the data supports. Use the language the utility used.

How do I find power outages by street?

Utility outage maps show which area is currently dark, but no public source publishes street-level outage history. GridProfile breaks every utility-reported outage with a known service area down to the specific streets that lost power (using public address data plus the location info utilities publish with each outage) and lists them in your weekly report with house-number ranges, restoration times, and a "repeat-victim streets" section showing which blocks keep losing power.

Can I get street-level outage data for door-knocking?

Yes, that's exactly what the Street-Level Outage Report is for. Each event becomes a card listing the streets affected with house-number ranges (e.g. "NE 68th Pl 12320–12340, 8 homes"). Click any address on the PDF and Google Maps opens to that address. The accompanying Streets CSV ranks every affected street in your territory by total home-hours of disruption, so the highest-impact blocks are at the top of your canvas list.

Which streets in my territory lose power most often?

Your weekly report flags "repeat-victim streets": blocks hit by two or more separate grid events in the window. These are the streets where the door-opening line writes itself: a homeowner on a block that was on the outage report three times this month is a different sales conversation than one who hasn't thought about it in years. The Streets CSV carries a repeat_victim flag and a cause-history column so you can lead with the specific pattern (trees, equipment, vehicle) showing up on that block.

Can I use this for direct mail or postcard routing?

Yes. The Streets CSV lists every affected street with its ZIP, city, home-hours impact, and single-family-home density at the ZIP level. Sort by total_home_hours and the top streets are your priority mailer routes. The address-level PDF includes house-number ranges per street so a mail house can build a saturation list without you having to look up addresses yourself.

What does this look like for phone outreach?

Open the Streets CSV, filter for repeat_victim = true, sort by total_home_hours desc, and you have a call list. The Address PDF gives you the cause and duration to mention by name (e.g. "Saw your block on Marketplace Ln was on the outage report three times this month, latest was March 22, equipment failure each time"), and the conversation walks itself toward a resilience pitch.

How do I find power outages near a specific address?

Submit your county and we'll email you a PDF listing every utility-reported outage in that county along with the streets each one affected, including house-number ranges where available. There's no single public source that does this. Federal datasets like DOE ODIN and EAGLE-I report at the county level (averaging fifty to two hundred ZIPs into a single number) and utility outage maps disappear once power is restored. GridProfile holds the history.

Why are only some states and counties available in the dropdown?

We don't sell territory we can't cover. The form only lists states and counties where at least 30 days of outage data and street-level address coverage are already loaded. Every accepted submission yields the full 4-file report. New territories come online as scrapers and address packages finish loading, so if your county isn't listed yet, it will be soon.

Where does GridProfile's data actually come from?

Every data point traces back to a government or utility source. Nothing is estimated or modeled from third-party proxies.

  • Real-time grid disturbances come from the Department of Energy's ODIN system (updated every 10 minutes) and direct feeds from 70+ utilities (including Duke Energy, Entergy, PG&E, ComEd, Dominion, Oncor, Georgia Power, and the entire FirstEnergy and Exelon family) plus 90+ electric cooperatives.
  • Historical grid data comes from the DOE's EAGLE-I archive, which contains 15-minute-interval outage observations going back to 2014.
  • Single-family home percentages come from the U.S. Census Bureau's American Community Survey, table B25024 ("Units in Structure"), at the ZIP-code level.
  • Homeowner counts, home values, demographics (work-from-home %, seniors 65+, heating fuel type) come from additional ACS tables at the county level.
What exactly do I get in the free report?

Four files emailed within minutes:

  1. Street-Level Outage Report PDF: per-event cards with affected streets, house-number ranges, restoration times, and a repeat-victim section. Clickable Google Maps links on every address.
  2. Streets CSV: one row per affected street, with home-hours impact, cause history, ZIP demographics, and a repeat_victim flag.
  3. Territory Brief PDF: stat cards, county comparison, duration histogram, and what changed since last week.
  4. Territory ZIPs CSV: every ZIP in your counties, ranked by grid activity with demographics.
What do paid subscribers receive, and how often?

Same four files, two cadences:

  • Weekly alert (every Monday): last 7 days of grid activity in your territory. Weeks with fewer than 10 events are skipped so you're not getting empty reports.
  • Monthly recap: full 30-day lookback with cumulative event counts, repeat-victim patterns, and refreshed demographics.

Everything arrives as email attachments: no login, no dashboard, no software to learn.

How is this different from buying leads?

Lead vendors sell recycled names: someone who filled out a form weeks ago and has been sold to a dozen installers. GridProfile gives you territory intelligence, not contact lists: the streets where the grid is weakest and the ZIPs where homes are owner-occupied and single-family. You bring your own outreach (door knocking, direct mail, geo-fenced ads) and you're the only installer using that signal. Exclusive to your territory, refreshed weekly, not recycled across buyers. Nobody else publishes outage history at the street level. The closest public source stops at the county.

What's the difference between the streets report and the canvassing leads?

Two products, two motions. The weekly streets report ($149/mo) is raw material for outreach you run yourself: call lists, geo-fenced ads, mail routes. Every affected street, up to 3 counties, every Monday.

The canvassing leads name the owner on every door and cluster the doors into walking routes, built for field teams. Priced per door; the streets report is a flat monthly.

Can generator or battery storage companies use this data too?

Yes. The same outage data that drives solar prospecting works for any backup power product. Generator dealers use GridProfile to find counties with long restoration times: the longer the average outage, the stronger the case for a whole-home generator. Battery storage installers target ZIPs where outages are frequent but short, since batteries handle those well. The CSV includes average repair hours and cause breakdowns that apply to any energy resilience sale, not just solar.

Which utilities and states do you cover?

All 50 states, DC, and Puerto Rico: over 3,100 counties. The DOE's ODIN feed covers every reporting utility, and on top of that we run direct scrapers against 70+ utilities (Duke, Entergy, PG&E, ComEd, Dominion, Oncor, Georgia Power, FirstEnergy and Exelon families, AEP subsidiaries, and more) plus 90+ electric cooperatives. If a U.S. utility reports outage data, we're almost certainly tracking it.

How current is the data?

We check for new grid events every 10 minutes from both the federal ODIN system and direct utility feeds. When your weekly report lands on Monday, the most recent datapoint is about 10 minutes old. Census demographics and housing data update annually when the ACS releases new estimates. Your report always tells you the data-freshness date so you know exactly what window you're looking at.

What do the columns in the Streets CSV mean?

Here are the key columns, in plain English:

  • street, postcode, city: the affected street, its ZIP, and the locality.
  • total_home_hours: the impact metric: sum of homes × hours across every event that hit this street in the window. Sort descending for your top canvas blocks.
  • repeat_victim: true if the street was hit by 2+ separate events in the window. The repeat list is where the door-opening line writes itself.
  • event_count, latest_event_date, cause_history: how many times the block was on the outage report, when last, and the cause pattern (e.g. "Tree, Equipment, Vehicle").
  • housenumber_range: e.g. "12320–12340" when addresses are dense enough; blank when scattered.
  • homes_touched: the address count behind the impact metric.
  • maps_url: clickable Google Maps URL per row (works in Excel and Sheets).
  • data_source_label: how we identified the street. Values are polygon, near_point, or fallback, listed in order from most precise to least.
  • pct_single_family, median_home_value, pct_work_from_home, pct_65_plus, pct_heat_electric, pct_heat_propane: ZIP-level demographics included on every row.
How do solar, generator, and battery installers use power outage data to find customers?

Power outages are a demand signal: a homeowner whose block just lost power is a different conversation than one who hasn't thought about the grid in years. The Streets CSV ranks every affected street by total home-hours of disruption: sort by it for your canvas list, by repeat_victim for your phone list, or use the PDF's house-number ranges for direct mail.

Why ZIP-level beats county-level for installers →

What's the best data source for solar territory planning?

The strongest territory signals combine grid reliability and housing type. Grid disturbance data (from DOE's ODIN system) tells you where power is unreliable. Census data tells you which ZIPs have the most single-family, owner-occupied homes. GridProfile pulls both together at the ZIP level (ranked and scored), so you don't have to cross-reference multiple government databases yourself.

I already got a report. How do I get in touch?

Just drop your email and I'll reach out personally.

Latest from GridProfile

View all insights →