Cuyahoga County, Ohio lost power for 51,958 customers on March 30, 2026. The cause listed in the public utility data: nothing. No explanation. No category. No follow-up.
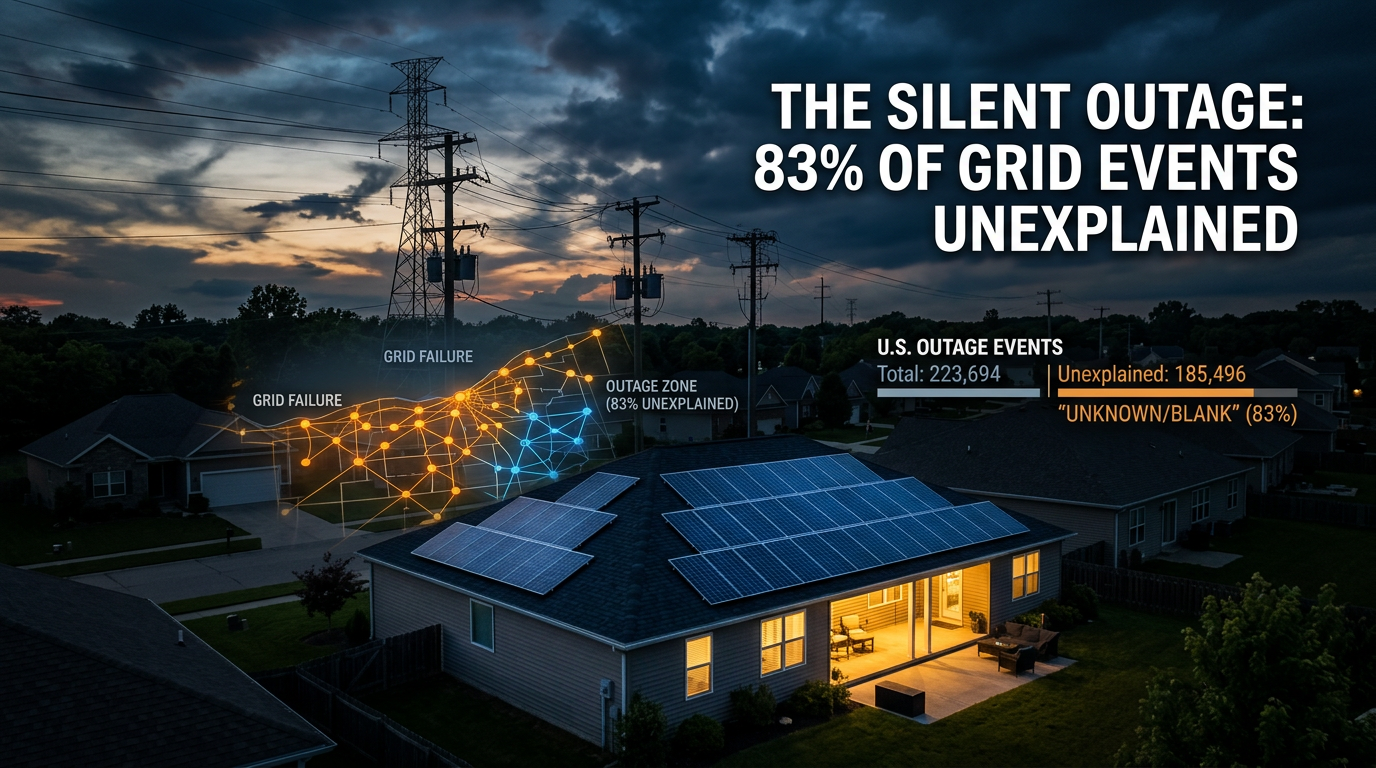
That's not unusual. In the last 30 days, 83% of all outage events across the U.S. had no identified cause. Out of 223,694 total events, 185,496 were filed as some version of "unknown," "under investigation," "pending," or simply left blank. The gap between what utilities know and what they tell the public is one of the largest blind spots in U.S. energy data.
How many power outages go unexplained?
185,496 out of 223,694 events in the last 30 days, or 82.9%, had no identified cause in public reporting. These events affected over 3.5 million customers.
The "unknown" label covers a range of non-answers. 123,250 events had no cause string at all — the utility reported the outage but provided zero explanation. Another 10,845 events were labeled "Pending Investigation." 8,688 said "Under Investigation." 7,473 said "Investigating." Over 4,000 were listed as "PATROLLING," which is a crew status, not a cause.
Only 38,198 events in 30 days had an identified cause: equipment failure, vegetation, weather, animals, vehicles, or fire. That's 17% of all events with an actual explanation.
Which utilities report outage causes, and which don't?
Some utilities publish cause data for most of their outages. Southern California Edison reports causes for 88-91% of events. Consumers Energy (Michigan) explains 93.9% of 1,777 events. Duke Energy Carolinas and Duke Energy Progress report causes for 40-57% of events. When these utilities say "equipment failure" or "vegetation contact," the data is useful.
Other utilities don't publish cause data at all. Their public outage APIs simply don't include a cause field. Entergy (Louisiana, Arkansas, Texas, Mississippi) reported 20,520 events in 30 days with no cause data available. Georgia Power: 8,365 events, no causes. Alabama Power: 7,842 events, no causes. These utilities track outages and show them on their maps, but the public feeds don't include why the power went out.
PG&E (California) is in between. Its API includes a cause field, but for 12,569 events affecting 549,753 customers, the field says things like "PATROLLING" or "EMERG REPAIRS" — crew dispatching statuses, not causes. Only a fraction of PG&E's events are classified as equipment failure, vegetation, or weather.
Do unknown-cause outages ever get explained later?
Rarely. Most events filed as "Pending Investigation" or "Under Investigation" stay that way in the public data. Utilities update their internal systems, but the public-facing outage maps and DOE reporting rarely get retroactive cause data.
The ODIN system (the DOE's real-time utility reporting feed) shows an 83.3% unknown rate across all utilities. This isn't a scraper artifact or a data gap. It's how utilities report.
Some unknowns are genuinely hard to diagnose. A momentary voltage dip that trips a relay and resets 30 seconds later is hard to trace. But 51,958 customers losing power in one event in Cuyahoga County isn't a momentary dip. Ocean County, New Jersey had an event affecting 7,185 customers that lasted 15.5 hours with no cause listed. Erie County, Pennsylvania: 20,836 customers, 63.8 hours, no cause.
These are multi-day, city-scale outages with no public explanation.
What does outage cause data actually look like?
When utilities do report causes, the data is useful. In the last 30 days across all events with an identified cause:
- Equipment failure is the top category — by a wide margin. It accounts for more than 3x the volume of weather causes when utilities do label events. "Equipment Problems" averaged 9.1 hours to restore, affecting an average of 92 customers per event. "Upgrading Equipment" (proactive replacements) averaged 8.4 hours and hit 115 customers per event.
- Vegetation contact (trees hitting lines) averaged 6.1 hours per event. It's the leading cause of long outages across most states.
- Vehicles hitting utility poles averaged 7 hours per event. Animals averaged 4.1 hours. We covered the full breakdown of unusual causes in a separate post.
- Weather accounted for 1,232 events at 5.7 hours average.
This is the 17% of events where the data is actually informative. The other 83% is a black box.
Why does this matter for solar and backup power sales?
An unexplained outage is still an outage. The homeowner who sat in the dark for 15 hours doesn't care whether the utility filed a cause report. But the cause data, when it exists, tells you something about whether it'll happen again.
Equipment failure is a structural problem. Vegetation contact is seasonal but recurring. An "unknown" outage in a county with aging infrastructure probably has the same root cause as the equipment failures next door. The utility just didn't bother classifying it.
For territory planning, the cause gap is actually an opportunity. Counties with high event counts and high unknown rates have utilities that are less transparent about their grid problems. That usually correlates with less investment in prevention. If a utility can't explain why your power went out, it probably can't explain what it's doing to stop it from happening again. That's the conversation a solar installer can have at the door.
Counties where outages happen almost every day are territories worth working regardless of cause. But knowing that 83% of those events go unexplained adds a layer to the pitch: "Your utility can't even tell you why the power went out."
Grab a free grid profile to see which ZIPs in your territory had outages this week, what caused them (when the utility bothered to say), and how long they lasted.