Tarrant County, Texas logged nearly 5,000 outage events in the last 30 days. That number tells a solar or generator installer that the Fort Worth metro is a hot territory. It doesn't tell you whether to spend Saturday in Arlington, Bedford, or Mansfield. Tarrant County alone spans 76 ZIP codes, and the outage history under each one is not the same.
If you run a solar, battery, or generator sales team, that gap, between county-level numbers and ZIP-level reality, is where most territory plans go wrong.
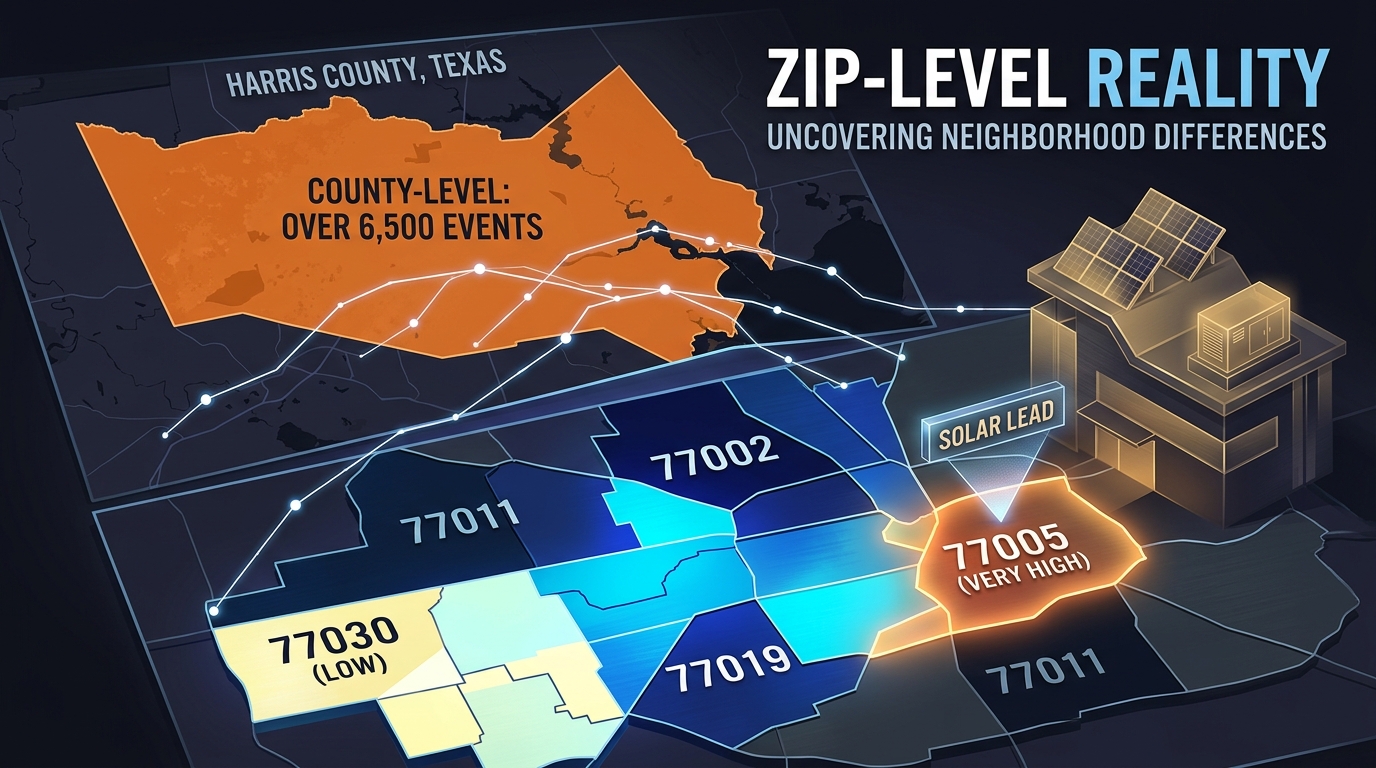
Why does ZIP-level outage data matter for installers?
ZIP-level outage data shows you which specific neighborhoods inside a hot county have actually lost power, and which haven't.
A homeowner who sat in the dark for six hours last Tuesday is a different conversation than a neighbor across town whose grid hasn't blinked all year. They're both inside the same county, often inside the same utility territory, sometimes only a few miles apart. County-level maps put them in the same bucket. ZIP-level data doesn't.
Solar reps notice this at the door. People who recently lost power are listening. People who haven't are polite at best.
For generator dealers and battery installers, the same gap is the whole pitch. A whole-home generator is a backup-power purchase. The buyer is someone who has lived through outages, not someone who has read about them.
Why do county-level outage maps miss the point?
County-level maps treat 50 to 200 ZIPs as a single number, and that average smooths out the data points an installer actually needs.
A typical urban county might have a downtown grid that almost never fails and an exurban grid that fails every other week. The county total averages those out and tells you nothing about either. The same is true for almost every metro in the country. Tree cover, line age, weather exposure, substation density. All of these vary block by block. Counties don't.
That's why a "hot county" you picked off a state map can still feel cold when your reps spend a weekend canvassing the wrong half of it.
How much do outages vary between ZIPs in the same county?
Outage frequency between ZIPs in the same county routinely varies by an order of magnitude.
A few patterns we see often:
- A coastal county where the inland ZIPs see two outages a month and the bayou-facing ZIPs see twelve.
- An urban county where downtown ZIPs almost never lose power and exurban ZIPs lose it weekly.
- A storm-belt county where one substation footprint takes the brunt of every event and the rest of the county barely notices.
The county number is the same in every one of those cases. The on-the-ground reality isn't.
What do solar and generator installers do with ZIP-level data?
Solar and generator installers use ZIP-level outage data to prioritize neighborhoods, time their pitch to recent events, and stop wasting drive time on blocks where nothing has happened.
A few of the practical uses we hear from installers:
- Canvassing routes: pull the ZIPs in the service area with the most recent outage activity, work those first.
- Inbound lead routing: when a lead comes in, the rep can see how many outages that ZIP has had in the last 30 days and lead the call with the local number.
- Post-outage timing: a ZIP that just had a multi-hour outage is a different conversation for the next two weeks than the same ZIP six months later.
- Generator and battery sizing: frequency and duration patterns by ZIP shape the runtime, fuel-supply, and battery-hour conversation. We broke down the generator vs. battery split in a separate post.
The product is different. The data move is the same: get out of the county view.
How do you get power outage data by ZIP code?
Most installers can't pull ZIP-level outage data on their own. Public sources stop at the county, utility feeds are fragmented, and the assembly work runs into hundreds of hours. We walk through where to actually find outages by ZIP in a companion post.
We built GridProfile to skip that work. Pick a state and up to three counties and we send back the ZIP-level outage history for your territory: which ZIPs had outages, how often, how long they lasted, and which ones look ripe for a solar territory plan or a backup-power pitch.
If you've been working off a county map, the move to ZIP is the single biggest jump in canvassing efficiency we see installers make. The next jump, street-level beats ZIP for canvassing specifically, is the same logic one resolution finer.