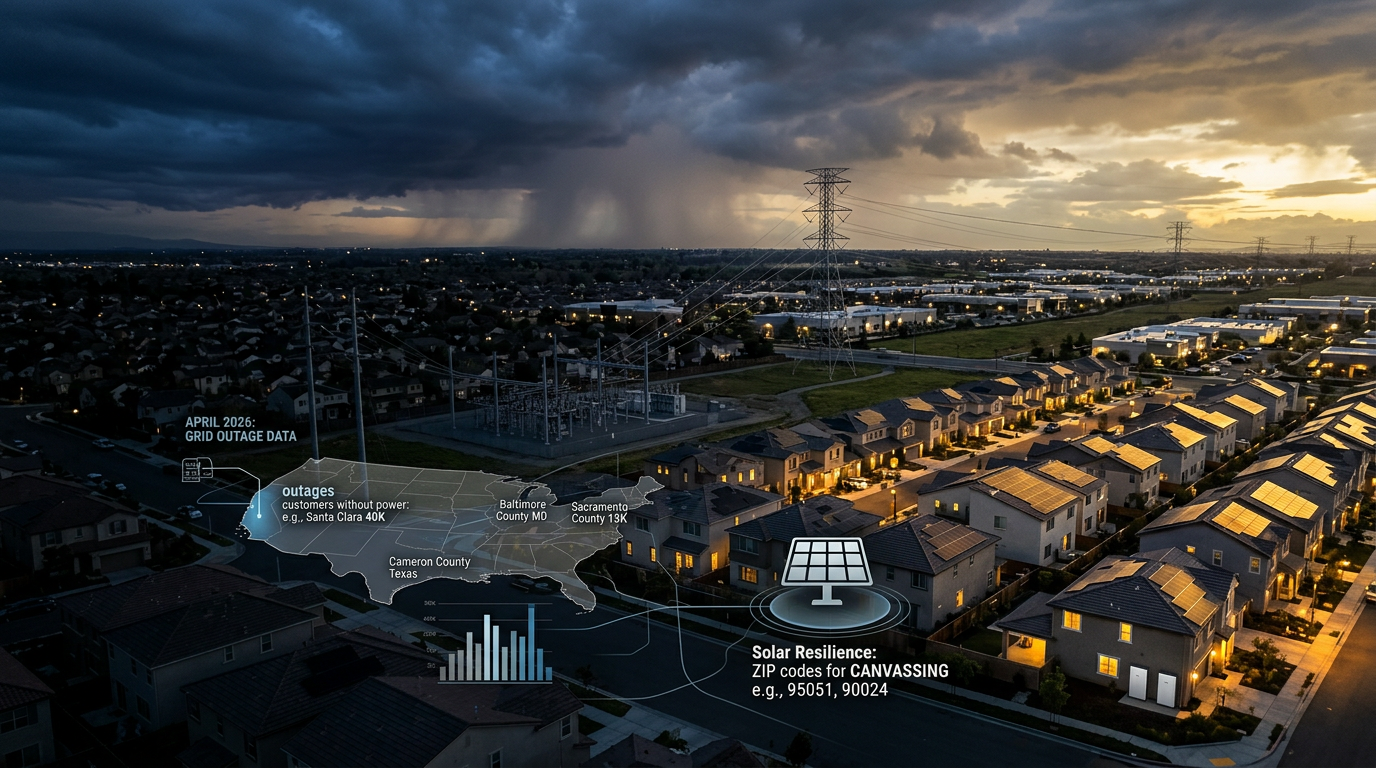
Santa Clara County, California lost 40,993 PG&E customers in a single April 12 event. Los Angeles County lost 20,027 customers to Southern California Edison on April 26, with a near-simultaneous 19,588 in a separate event the same day. Sacramento lost 13,515 to a damaged-equipment fault on April 10. PG&E and SCE were running cleanup crews for most of the month.
Across the country, Baltimore County, Maryland, Alameda County, California, Cameron County, Texas, Caddo Parish, Louisiana, and dozens of other counties logged at least one outage event on every single day of the past month. If you run a solar, battery, or generator sales team, those daily-outage counties are April's short-list.
Which states had the most power outages in April 2026?
New Jersey, Maryland, and California topped the country for outage event density in April 2026, with New Jersey averaging 541 outage events per county in the last 30 days. For how these density numbers are built and what they mean, see the state-by-state grid reliability ranking.
| State | Events | Counties Hit | Events per County |
|---|---|---|---|
| New Jersey | 11,378 | 21 | 542 |
| Maryland | 7,631 | 15 | 509 |
| California | 21,798 | 58 | 376 |
| Louisiana | 19,157 | 60 | 319 |
| Texas | 59,778 | 216 | 277 |
| Alabama | 15,600 | 58 | 269 |
| Michigan | 17,627 | 70 | 252 |
Texas had the largest raw event count by far, with nearly 60,000 outages across 216 counties, but its sheer geographic size pulls the per-county density below the smaller, denser East Coast states. For an installer, the choice between density and volume comes down to whether you want to knock five doors on the same block or drive 40 minutes between appointments. That tradeoff is exactly what we worked through in how to pick a solar sales territory.
California's number is dominated by PG&E and Southern California Edison territory. Louisiana's by Entergy and the cooperatives. New Jersey is JCP&L and PSE&G splitting the state.
Which counties had the most outages last month?
Harris County, Texas led the country with 8,413 outage events across four reporting utilities. Tarrant County (Fort Worth) was second at 4,998. Dallas County: 4,325. Orleans Parish, Louisiana: 3,851.
| County | State | Events |
|---|---|---|
| Harris | Texas | 8,413 |
| Tarrant | Texas | 4,998 |
| Dallas | Texas | 4,325 |
| Orleans | Louisiana | 3,851 |
| St. Louis | Missouri | 3,580 |
| Jefferson | Alabama | 3,290 |
| Cook | Illinois | 3,121 |
| Hinds | Mississippi | 2,562 |
| Montgomery | Texas | 2,522 |
| Salt Lake | Utah | 2,211 |
Texas dominates the top of this list because of how granularly its utilities report. A single localized outage in Houston shows up as one event whether it affected three customers or 7,000, so high event counts reflect both grid stress and reporting density. The biggest single events of April (the ones that knocked out tens of thousands of customers at a time) are listed further down.
A separate cut of the data, counties with at least one outage on every single day of the past month, runs much longer. Baltimore County, Maryland led that list with 2,328 events across 31 days. Caddo Parish, Louisiana: 1,310 events, 31 days. Alameda County, California: 1,190 events, 31 days. We pulled the 12-month version of that leaderboard in a separate post.
What were the biggest single power outages in April 2026?
The largest single April 2026 outage event was Pacific Gas & Electric's April 12 outage in Santa Clara County, California, which affected 40,993 customers for about 80 minutes. The cause was logged as "unknown."
Other notable single events from April:
- April 26, Los Angeles County, California. Southern California Edison, 20,027 customers out for 8.6 hours. Cause logged as "Analyzing Problem."
- April 26, Los Angeles County. SCE again, 19,588 customers, near-simultaneous to the first. Both stayed in "Analyzing Problem" status throughout the restoration.
- April 15, San Juan County, Washington. Orcas Power & Light Coop, 15,062 customers, most of the San Juan Islands.
- April 10, Sacramento County, California. Sacramento Municipal Utility District, 13,515 customers out for 17.7 hours. Cause: "Damaged equipment."
- April 18, Monterey County, California. PG&E, 8,777 customers, status: "PATROLLING."
- April 12, Allegheny County, Pennsylvania. Duquesne Light, 8,714 customers, restored in about an hour.
- April 8, Pierce County, Washington. Puget Sound Energy, 7,686 customers, "Under investigation."
California showed up in the top single events more than any other state. The combination of long-duration restorations (Sacramento at 17.7 hours) and cause descriptions like "Analyzing Problem" or "PATROLLING" tells you what the homeowner experience looked like. The lights went off, and the utility had no answer.
Which ZIP codes had the most power outage activity?
The ZIP codes sitting on top of April's hottest counties are where installer canvassing has the most leverage. Those ZIPs share the same county-level grid infrastructure and the same outage history floor. In Harris County, Texas alone, that includes:
- 77002, 77003, 77011 (Downtown Houston, East End)
- 77006 (Montrose)
- 77020, 77029 (North and Northeast Houston)
- 77036, 77081 (Sharpstown, Gulfton)
- 77041, 77088, 77091 (Northwest Houston)
- 77375, 77389 (Tomball, Spring)
- 77502, 77504 (Pasadena)
- 77571 (La Porte)
- 77586 (Seabrook)
Every one of those ZIPs sits inside a county that logged 8,413 outage events in 30 days. The county number is a shared floor across all of them, which is the limitation of county-level data. ZIP-level breakdowns inside the county show meaningful variation we covered in why outage data needs to be ZIP-level, not county-level.
The same pattern holds in other April hot counties:
- Tarrant County, Texas (4,998 events). Fort Worth metro ZIPs: 76101, 76104, 76110, 76112, 76116, 76123, 76134.
- Dallas County, Texas (4,325 events). Dallas metro ZIPs: 75201, 75204, 75218, 75228, 75230, 75240.
- Orleans Parish, Louisiana (3,851 events). New Orleans ZIPs: 70112, 70115, 70117, 70119, 70124, 70125, 70128.
- Cook County, Illinois (3,121 events). Chicago ZIPs: 60601, 60607, 60614, 60618, 60625, 60629, 60632.
- Salt Lake County, Utah (2,211 events). SLC metro ZIPs: 84101, 84105, 84109, 84115, 84117.
For the actual outage history under any specific ZIP, see how to find power outages by ZIP.
What caused most of the outages in April 2026?
Most April 2026 outages had no public cause. The single largest "category" in the cause breakdown was "Pending Investigation" with 27,069 events. Add in "Under Investigation," "Currently Assessing," "Investigating," "Under Evaluation," "Unidentified," and the various blanks, and the answer is the same as it was last month: the utilities themselves haven't said what broke.
Of the events that did get a cause, the breakdown was familiar:
- Equipment failure. "Equipment issue detected" (4,804), "Upgrading Equipment" (3,558), "Equipment Problems" (2,031).
- Storm damage. 3,578 events, averaging 56 customers and 5.5 hours per event.
- Scheduled / planned. Roughly 22,000 events across various "planned maintenance" labels. These should be filtered out of any outage analysis aimed at finding pain. They're not surprise outages.
We covered the cause-attribution gap in detail in why utilities don't explain outages, and the bigger equipment-vs-weather story in what actually causes US power outages.
How should installers use April's data going into May?
April's data is a fresh canvassing list, and the May 2026 edition is now up with the next month's numbers. Recent outages convert better than old ones. The homeowner who lost power on April 12 in Santa Clara, April 15 in the San Juan Islands, or April 26 in LA County is two-to-six weeks out from that experience right now, exactly the window where backup power and solar-plus-battery pitches land hardest. We wrote up how to pitch solar after a power outage for the door conversation specifically, and how installers use outage data for leads for where this data fits in the broader lead-gen mix.
The pattern from April is clear: California, Texas, and the Northeast and Mid-Atlantic corridor are doing the heavy lifting on grid stress. The chronic counties that lost power on every single day of the month (Baltimore, Alameda, Caddo, Butler, Cameron, Albany, Burlington) are where every day of May gives an installer a fresh reason to knock.
If you want the ZIP-level cut for your own state and counties, grab a free grid profile. Pick up to three counties and we'll send the outage history at the ZIP level so you can build your canvassing routes around it.