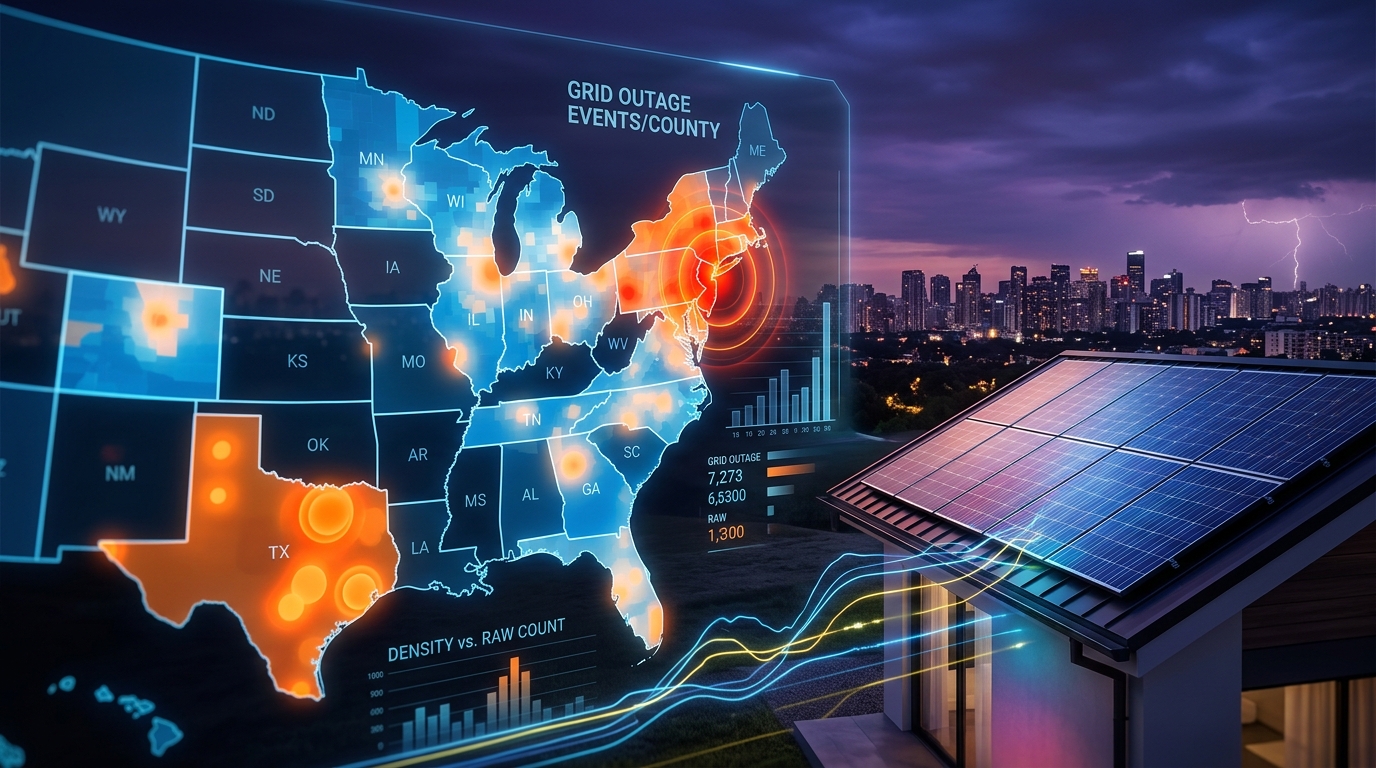
New Jersey averages 393 outage events per county per month. Texas averages 154. If you're choosing between the two for a solar territory, the raw event count says Texas. The density says New Jersey. That difference decides whether you're driving 40 minutes between appointments or knocking five doors on the same block.
The best solar territories have three things: a grid that breaks often, homes that can go solar, and electricity rates that make the math easy.
Which states have the best solar sales territories right now?
The best territories have high outage density, high single-family home rates, and high electricity prices. Based on the last 30 days of grid data, five states score well on all three:
- New Jersey — 393 events per county, the highest density in the country. 27.6 cents/kWh in Atlantic and Cape May counties. Gloucester County has 76.5% owner-occupancy. Every county in the state had outages every day of the month.
- California — 353 events per county with 36.2 cents/kWh residential rates, the highest in the dataset. Contra Costa County hit 791 events in 90 days with 65.7% owner-occupancy and a $866,800 median home value. High rates mean short payback periods.
- Maryland — 348 events per county across just 15 counties. Baltimore County had outages on 23 of the last 30 days. At 4.6 hours average restoration, these aren't quick flickers.
- Massachusetts — 203 events per county. Essex County logged outages on 23 of 30 days with events hitting up to 1,731 customers at once.
- Utah — 189 events per county. Salt Lake County had 1,779 events in 30 days. Davis County had outages on 23 of 30 days. The state averaged 6.0 hours to restore power, double the national median.
Texas has the most total events (32,811) but they're spread across 213 counties. That's a huge state with pockets of activity, not wall-to-wall grid stress. If you're in Texas, you need to drill into the right counties.
Which counties should solar installers target?
The top 10 counties by outage events in the last 30 days:
- Harris County, TX — 4,997 events, 3 utilities reporting, max single event hit 6,967 customers
- Cook County, IL — 2,741 events
- Franklin County, OH — 2,562 events, 3 utilities reporting
- Dallas County, TX — 2,420 events
- Tarrant County, TX — 2,115 events
- Los Angeles County, CA — 1,964 events, averaging 131 customers per event
- Salt Lake County, UT — 1,779 events
- Montgomery County, TX — 1,667 events, 3 utilities reporting
- Jefferson County, AL — 1,633 events
- Jackson County, MO — 1,593 events
Raw event counts are the starting point, not the whole picture. Harris County has the most events, but it also has 4.7 million people. What matters for territory planning is whether those events are hitting neighborhoods where you can actually sell solar.
Cross-reference with single-family home density and owner-occupancy rates. A county with 2,000 outage events and 70% single-family homes is a better door-knocking territory than one with 5,000 events and 30% apartments. We covered how density changes the picture in our state-by-state grid breakdown.
How do I find the right ZIP codes to canvass?
County-level data gets you to the right metro. ZIP-level data gets you to the right streets. We made the longer case for outages by ZIP, not county in a separate post.
The three numbers that matter at the ZIP level:
- Recent grid events — ZIPs with events in the last 7 days are where homeowners are thinking about their power right now. Not last month, not last year. This week.
- Single-family home % — From Census table B25024. A ZIP at 85% single-family homes is almost all rooftops you can put panels on. A ZIP at 40% is mostly apartments and condos.
- Owner-occupancy % — Renters don't buy solar. A ZIP with high outage activity but low ownership is a dead end for residential installs.
Sort by recent events first, then filter for ZIPs above 60% single-family and 50% owner-occupied. What's left is your knock list.
How long do power outages last, and why does it matter for solar sales?
Longer outages mean more motivated homeowners. The states with the longest average restoration times in the last 90 days:
- New York — 27.0 hours average. One in ten outages lasted more than 7.7 hours.
- Nebraska — 10.0 hours average, with a 90th-percentile of 14.4 hours.
- Oregon — 7.6 hours average, 90th-percentile at 11.9 hours.
- Utah — 6.0 hours average, 90th-percentile at 10.4 hours.
- California — 5.2 hours average, but a 90th-percentile of 12.1 hours. The long tail of extended outages is where the frustration lives.
A 2-hour outage is an inconvenience. A 10-hour outage is a homeowner googling "solar battery backup" on their phone. If you're choosing between two counties with similar event counts, pick the one with longer restoration times. Those homeowners have had more time to think about alternatives.
Counties with chronic outages are even better signals. Pierce County, Washington had outages on 24 of the last 30 days. King County had them on 23 days. Kern County, California: 23 days. These aren't places where the power went out once. These are places where it goes out every other day. That's a conversation starter that doesn't need a script.
What makes outage data better than buying solar leads?
A purchased lead is a name and phone number, sold to multiple installers, from a form someone filled out weeks ago. By the time you call, they've heard from a dozen competitors or moved on entirely.
Outage data works differently. It tells you where demand exists right now, not who expressed interest in the past. A ZIP that lost power on Tuesday has homeowners thinking about reliability on Wednesday. You're not competing with 11 other installers calling the same list. You're the one installer who showed up in the right neighborhood at the right time because you had the right data.
The same data works for battery storage and generator sales. A county with frequent short outages (under 4 hours) is a good battery market. A county with infrequent but long outages (8+ hours) is a generator market. We break down which territories fit generators vs. batteries in a separate post. And when you're at the door, knowing how to pitch solar after an outage makes the data actionable. The causes behind the outages tell you even more about infrastructure age and vulnerability.
Grab a free grid profile to see the ZIP-level breakdown for your counties, ranked by recent grid events, single-family home density, and electricity rates.