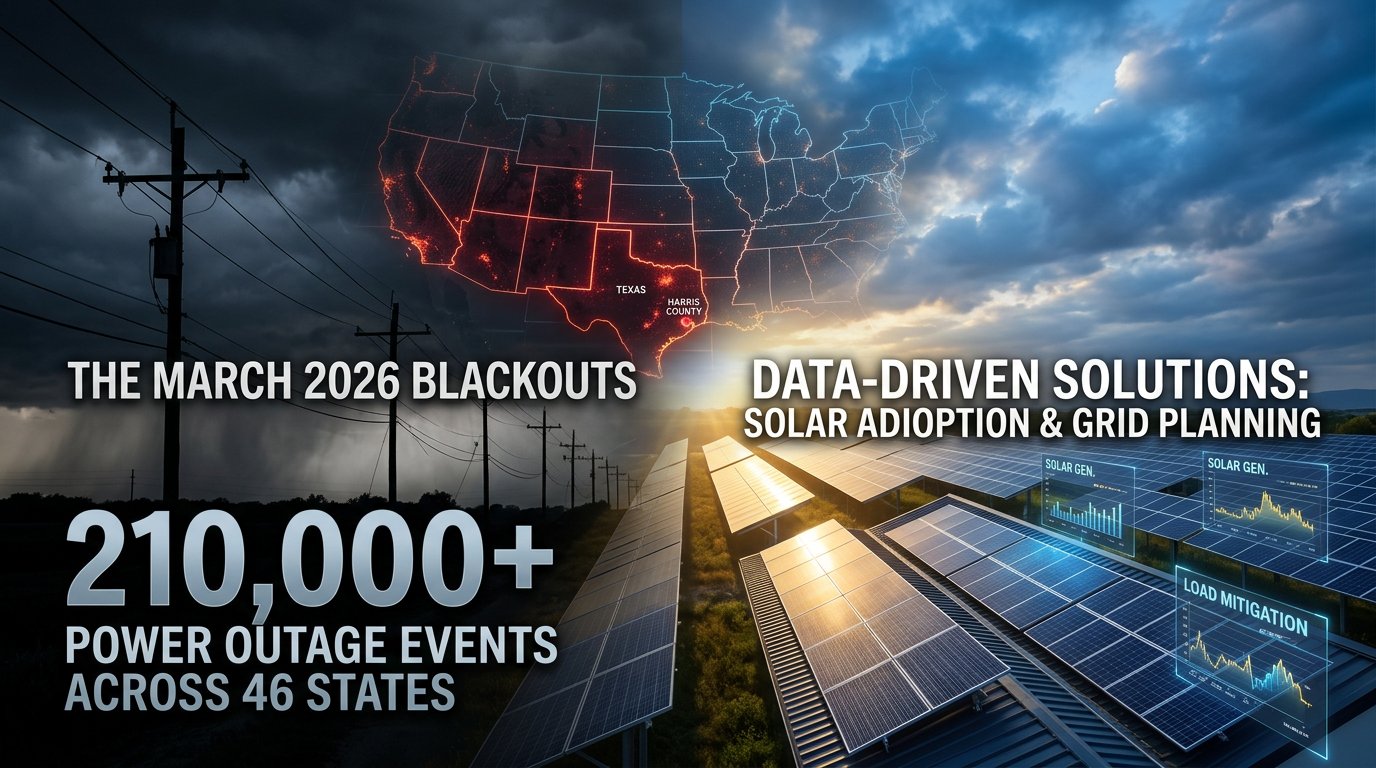
Over 210,000 power outage events hit 46 states in the last 30 days. That's roughly 7,000 grid disturbances a day spread across more than 2,000 counties. We looked at seasonal patterns and what's driving these numbers in a separate post, and pulled the April 2026 follow-up with hot ZIP codes once the next month's data was in.
Which states had the most outage events in March 2026?
Texas led with 31,919 events across 213 counties. Harris County alone had 4,799, more than most entire states. Dallas (2,354), Tarrant (2,061), and Montgomery (1,622) rounded out the list. Three or more utilities reported overlapping outages in Harris and Montgomery counties, which means these weren't isolated incidents.
California came in second at 19,777 events but hit far more customers: nearly 1.5 million affected. Los Angeles County averaged 134 customers per event, and single events knocked out over 5,800 customers at once. We have a full California county-by-county breakdown with cause data and demographics.
Ohio logged 13,335 events across 84 counties. Franklin County (Columbus metro) had 2,529 on its own.
Louisiana posted 10,433 events across all 60 parishes, continuing a pattern we covered in our state-by-state grid breakdown. That's 174 events per parish, almost six per day.
Which states have the worst grid reliability per county?
Raw event counts favor big states. Events per county tells you where the grid is actually under stress.
New Jersey had the highest density at 383 events per county across all 21 counties. That's nearly 13 per county per day. California was close behind at 341, Maryland at 336.
For solar territory planning, density matters more than volume. A state with 8,000 events spread across 21 counties is a different market than one with 32,000 events spread across 213. New Jersey's grid was under pressure everywhere. Texas had hot spots surrounded by quieter counties.
What caused power outages in March 2026?
The most common cause category is unknown: over 40,000 events where utilities reported some variant of "under investigation" or "pending." We dug into why so many outages go unexplained and which utilities are the worst offenders.
After unknowns and scheduled maintenance, equipment failure is the leading identified cause. Equipment-related outages averaged 9.2 hours to restore and affected an average of 89 customers per event. Proactive equipment upgrades averaged 8.3 hours and impacted 113 customers per event, accounting for over 300,000 total customers affected.
Vegetation contact (tree limbs on lines) averaged 6 hours per event. Not the most frequent cause, but consistently one of the longest to fix. Animals, balloons, and vehicles account for a smaller but steady share of events — we dug into the strangest outage causes in the data.
How long did power outages last by state?
Nebraska was the slowest at 10.6 hours average, with a 90th-percentile time of 17.1 hours. One in ten Nebraska outages lasted more than 17 hours.
Oregon averaged 7.6 hours. Utah averaged 6.0. California, despite the highest customer impact, averaged 5.2 hours but had a 90th-percentile of 12.1 hours, a long tail of extended outages pulling the average up.
The fastest states restored in under 3 hours on average. The gap between a 3-hour average and a 10-hour average is the gap between an inconvenience and a homeowner searching "whole home battery" on their phone.
Where should solar installers prospect based on March 2026 data?
Three markets stand out for Q2 territory planning (we break down how to pick a solar territory in more detail):
- Texas metro counties (Harris, Dallas, Tarrant, Montgomery) had the raw volume to fill a pipeline. Multiple utilities reporting means multiple customer bases getting hit.
- New Jersey and Maryland had the highest density. Every county in both states averaged more than 10 events per day. Smaller territory, but every county got hit.
- California had the most customers affected per event. Fewer events than Texas, but each one hit harder. At 36.2 cents per kWh, the highest rate in the dataset, the payback period on a solar install shrinks fast.
Counties with high event counts, long restoration times, and high electricity rates are where outage frustration converts fastest. Grab a free grid profile to see the ZIP-level breakdown for your counties — which neighborhoods had events last week, how long they lasted, and what percentage of homes are owner-occupied single-family.