Most installers can already pick a hot county. The harder question — which street to knock on Saturday morning — is the one that decides whether canvassing pays for itself.
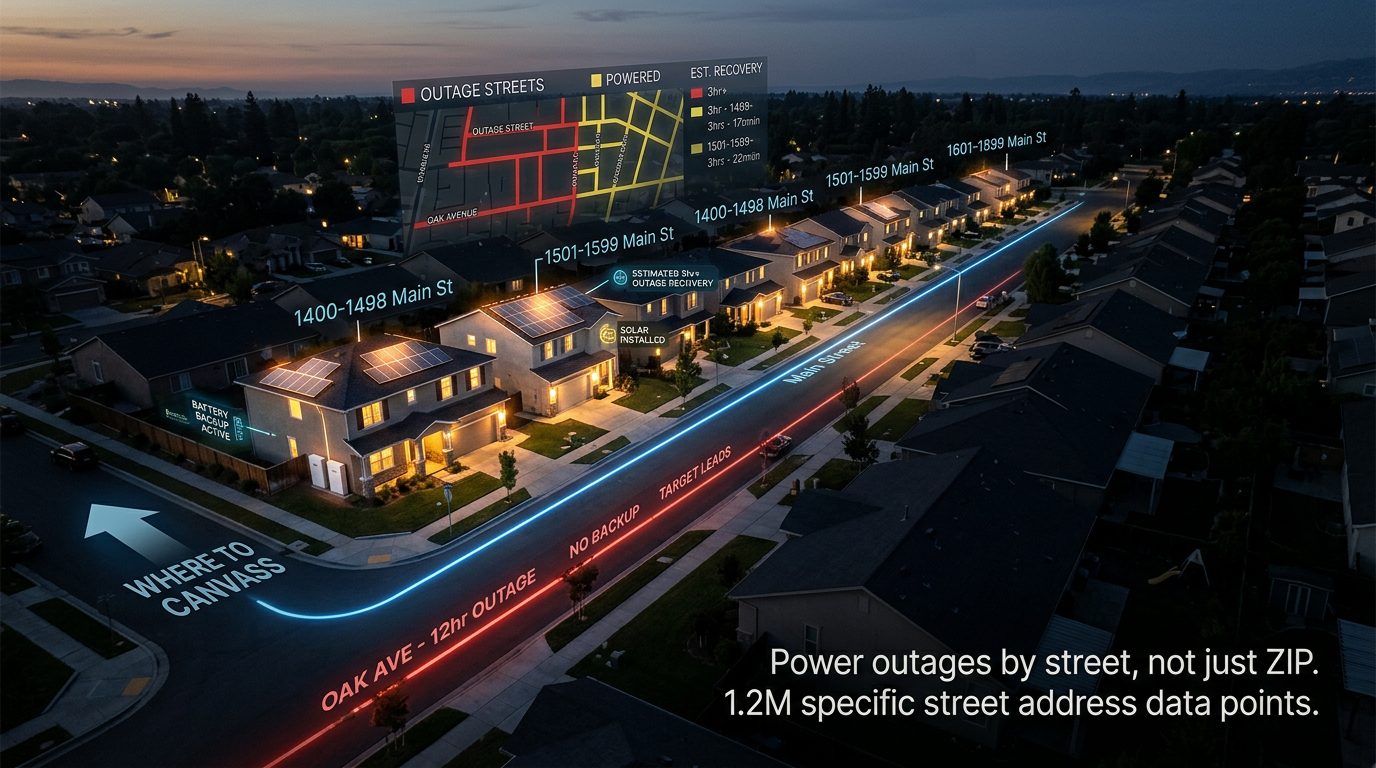
For the last few years, the closest public answer was a ZIP code. GridProfile now resolves every utility-reported outage with a known service area down to the specific streets that lost power, with house-number ranges, repeat-event flags, and clickable map links on every address.
That's the difference between a list of 76 ZIPs in Tarrant County and a list of the actual blocks where a homeowner sat in the dark last Tuesday.
How do I find power outages by street?
No public source publishes outage history at the street level. Utility outage maps show live polygons that disappear the moment power is restored. Federal datasets like DOE ODIN and EAGLE-I report by county, averaging fifty to two hundred ZIPs into one number. We walked through where to actually find outages by ZIP in a companion post — and street-level is a tighter ask still.
The way the data comes together is straightforward. Every event with a known polygon (or a known service point with a customer-count radius) gets intersected against an index of 164 million U.S. addresses across 38 states, with a small feather to catch addresses sitting at the polygon edge. The result is grouped by street and ZIP.
A test outage in Kirkland, Washington that the utility reported as 18 customers came back as 18 specific addresses on NE 68th Pl. The address count matched the utility's number exactly. That's the resolution the deliverable runs at.
What is a "repeat-victim street"?
A repeat-victim street is a block hit by two or more separate grid events inside the reporting window. Same address, different fault — trees one week, equipment the next, a car versus a pole the week after.
These streets are the highest-conviction door-knocking targets in any installer territory. A homeowner who lost power once last quarter is polite at the door. A homeowner who lost power three times in the last month is googling backup power on their phone before you finish your second sentence.
The pitch on a repeat-victim block doesn't need a script:
"I saw your block on Marketplace Ln lost power three times this month — latest was March 22, equipment failure each time. Have a minute?"
That opening costs nothing to deliver and shifts the door from interruption to acknowledgment. The data isn't on any public map.
Can I get street-level outage data for door-knocking and direct mail?
Yes — that's exactly what the deliverable is built for. The Streets CSV lists every affected street in your territory with home-hours impact, repeat-victim flag, cause history, and ZIP-level demographics riding along on every row. Sort by total_home_hours and the top of the list is your canvas route for the week. Sort by repeat_victim and you have a phone list.
For direct mail, the Street-Level Outage Report PDF carries house-number ranges per street — "NE 68th Pl, 12320–12340, 8 homes" — so a mail house can build a saturation list without geocoding anything. Every address in the PDF is a clickable Google Maps link, which makes route planning a two-click job.
The product split matters too. Solar reps work the dense suburban blocks with high rates and frequent short outages. Battery installers want the same blocks, especially the repeat-victims under four hours. Generator dealers work the exurban streets with long restorations. The same Streets CSV serves all three — you just sort by different columns. We broke down which territories fit generators versus batteries on the same data set.
Why don't utility outage maps show outages by street?
Utility outage maps are built for the customer who just lost power, not the installer who wants outage history. They display the active polygon at this minute and erase it once restoration completes. The map has no memory.
Even the polygon itself isn't broken down to the street names inside it. The utility cares which feeder is out, not which addresses sit on that feeder. The information exists — substation footprints, customer counts, restoration times — but it never reaches the public in a form an installer can act on. We covered why so many outages don't even have a cause listed separately; street-level naming is the same problem one layer up.
A few public-records and FOIA-style avenues exist for specific events, but they're slow, per-utility, and useless for territory planning where the question is "what happened last week."
What changes when you move from ZIP to street?
The county tells you which metro to be in. The ZIP tells you which side of town. The street tells you which block.
A solar rep who knows the ZIP is one of fifty reps calling that ZIP. A solar rep who knows that 12320 through 12340 NE 68th Pl lost power for two hours last Tuesday, and that the same block lost it again two weeks later, is the only rep with the data to lead with the specific event. The conversation is different.
For generator and battery dealers, the asymmetry is bigger. A homeowner who has already called three different dealers after a storm has heard the generic pitch. The dealer who walks up and names the date, the duration, and the cause — by street — closes faster.
If you've been working a ZIP-level outage map and wondering whether the next step exists, this is it. We made the longer case for outages by ZIP, not county when the previous level of resolution was the new thing. Streets are the next one.
Grab a free grid profile — pick a state and up to three counties, and we'll email you the streets in your territory that lost power most recently, with home-hours impact, repeat-victim flags, and the ZIP demographics on every row.