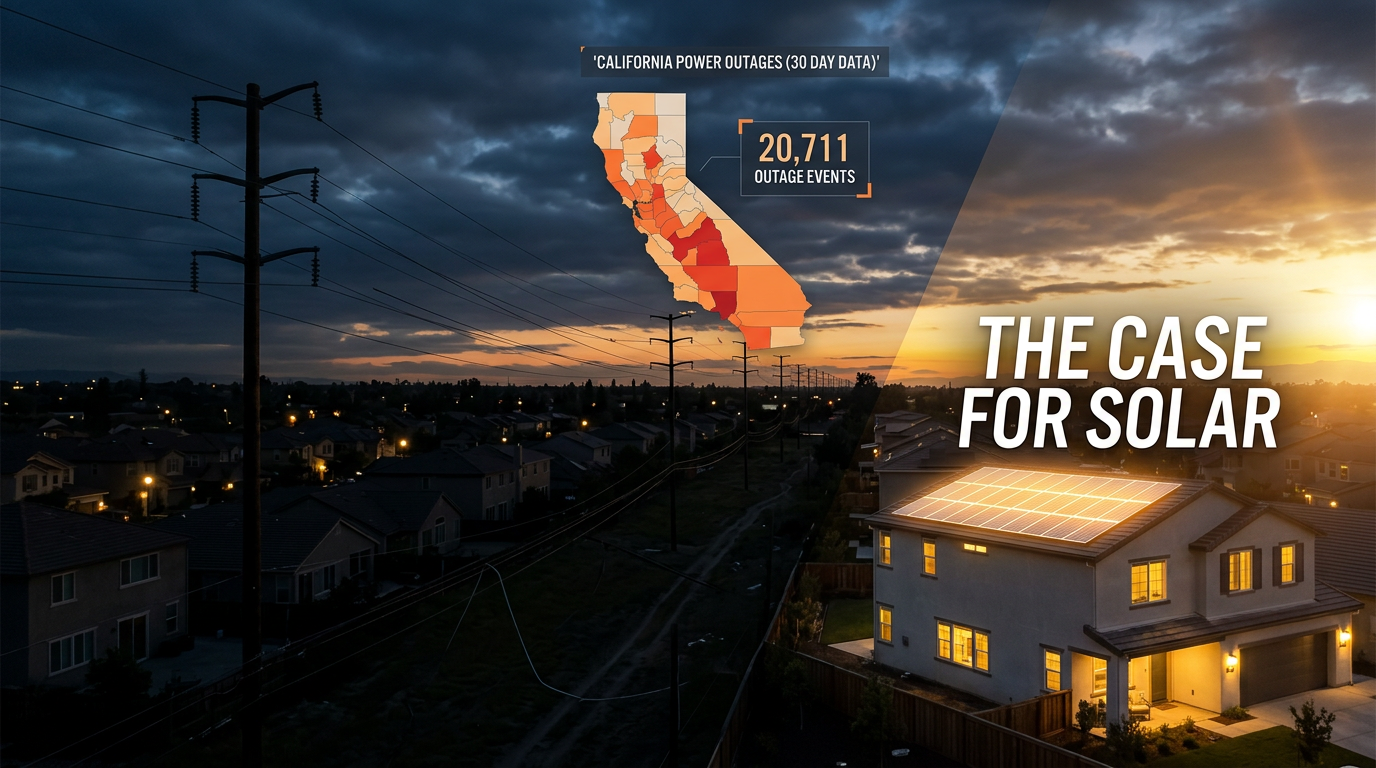
California had 20,711 power outage events across 58 counties in the last 30 days. Those events affected 1.56 million customers. Six counties lost power on 23 of the last 30 days. The state pays 36.2 cents per kWh for residential electricity, the highest rate in the country.
For solar installers, that combination of frequency, scale, and cost is hard to beat anywhere else in the U.S.
How often do power outages happen in California?
20,711 times in 30 days, or about 690 events per day across the state. That's 353 events per county on average, the second-highest density in the country behind New Jersey (393 per county). We covered the full state-by-state density ranking in a separate post.
Six counties had outages on 23 of the last 30 days:
- Los Angeles County — 1,974 events, with single events reaching 5,883 customers
- San Diego County — 515 events, max single event at 4,244 customers
- San Bernardino County — 884 events, max 4,016 customers
- Ventura County — 483 events, max 6,285 customers
- Kern County — 1,040 events, max 5,585 customers
- Orange County — 754 events, max 2,357 customers
These aren't storm recovery zones. They're counties where the grid breaks almost every day, all month.
Which California counties have the most outage events?
Los Angeles County led with 1,974 events, averaging 131 customers per event. When LA loses power, it hits hard. A single event in LA knocked out 5,883 customers at once.
The top 10 California counties by 30-day event count:
- Los Angeles — 1,974 events
- Santa Clara — 1,176 events
- Kern — 1,040 events, 3 utilities reporting
- Alameda — 1,007 events
- Fresno — 941 events, 3 utilities reporting
- San Bernardino — 884 events, averaging 141 customers per event
- Contra Costa — 801 events, with one event reaching 6,290 customers
- Riverside — 776 events, averaging 149 customers per event
- Orange — 754 events, averaging 178 customers per event
- San Mateo — 664 events
Sacramento had fewer total events (446) but one event took out 13,515 customers at once. Madera County had an event affecting 7,023 customers. Volume doesn't tell the whole story. Some of these counties are dropping entire cities at a time.
What causes power outages in California?
That depends on which utility you ask. PG&E explains only 4.2% of its outage events. Southern California Edison explains 88-91%.
PG&E reported 13,304 events in California in the last 30 days. Of those, 12,569 had no identified cause. The cause field in PG&E's data usually says "PATROLLING" (crew sent to investigate), "PLNND SHUTDOWN," or "EMERG REPAIRS." These are status updates, not causes. We looked at this utility transparency gap nationally and PG&E is one of the worst reporters in the country.
SCE is different. Its 3,584 events had causes listed for nearly 90%. When SCE says "equipment failure" or "tree contact," you can use that data.
From the events that do have causes:
- Equipment upgrades and failures are the top category. Proactive upgrades average 8.4 hours to restore. Equipment problems average 9.1 hours and hit 91 customers per event.
- Underground cable damage accounts for 151 events at 8.4 hours average. Pole upgrades: 789 events at 9.7 hours. These are long outages.
- Tree contact caused 86 events at 7.2 hours average, affecting an average of 177 customers each.
- Pole fires hit Solano County (360 customers, 13.2 hours), Kern County (339 customers, 7.3 hours), and Merced County (128 customers, 11.3 hours) in a single week. PG&E reported all of them.
The unusual causes show up in California too. Mylar balloons knocked out 900+ customers in LA over one weekend. Butte County lost 3,034 customers to a foreign object.
How long do California power outages last?
The average is 5.2 hours. But the 90th percentile is 12.1 hours. That gap is the story.
Most California outages resolve within a few hours. But one in ten lasts half a day or longer. Equipment failures and pole upgrades push restoration past 8-9 hours. Underground cable damage averages 10.6 hours. A homeowner who hits one of those long-tail events is sitting in the dark for most of a working day.
At 36.2 cents per kWh, California has the highest residential electricity rate in the country. That rate does two things for solar sales: it shortens the payback period on a solar install, and it means the hourly cost of not having power (running a portable generator, lost food, lost work) is higher than anywhere else. We walked through how to use rate data in a solar pitch in a separate post.
What are the best California counties for solar sales?
Counties with high outage events, high owner-occupancy, and high home values are where solar pitches convert fastest. In California, those are:
- Contra Costa County — 801 events, 65.7% owner-occupied, median home value $866,800, 21.3% work from home
- El Dorado County — 351 events, 62.2% owner-occupied, $679,900 median home value, 22.1% WFH
- Amador County — 127 events, 68% owner-occupied, $449,800 median home value
- Solano County — 366 events, 60.3% owner-occupied, $617,700 median home value
- Sonoma County — 430 events, 57.6% owner-occupied, $815,500 median home value
LA and Orange counties have the most events but lower owner-occupancy rates (around 50% and below). That means more renters who can't buy solar. The mid-size Bay Area and inland counties often have better ratios for door knocking.
Counties with high work-from-home rates are worth extra attention. Marin County has 31.5% WFH. San Francisco: 31%. Alameda: 25.7%. Nevada County: 25%. A remote worker who loses power loses a day of income. That's a different conversation than someone who comes home from the office to a warm fridge.
For the ZIP-level breakdown in any of these counties — which neighborhoods had events this week, how long they lasted, and what percentage of homes are single-family — grab a free grid profile.