The U.S. grid logged over 210,000 outage events across 46 states in the last 30 days. Whether that's "worse" than last year depends on what you measure and where you look. National trend data is noisy. But the seasonal patterns, cause breakdowns, and state-level density numbers tell you something more useful: when and where outages hit hardest, and what's behind them.
Are power outages getting worse?
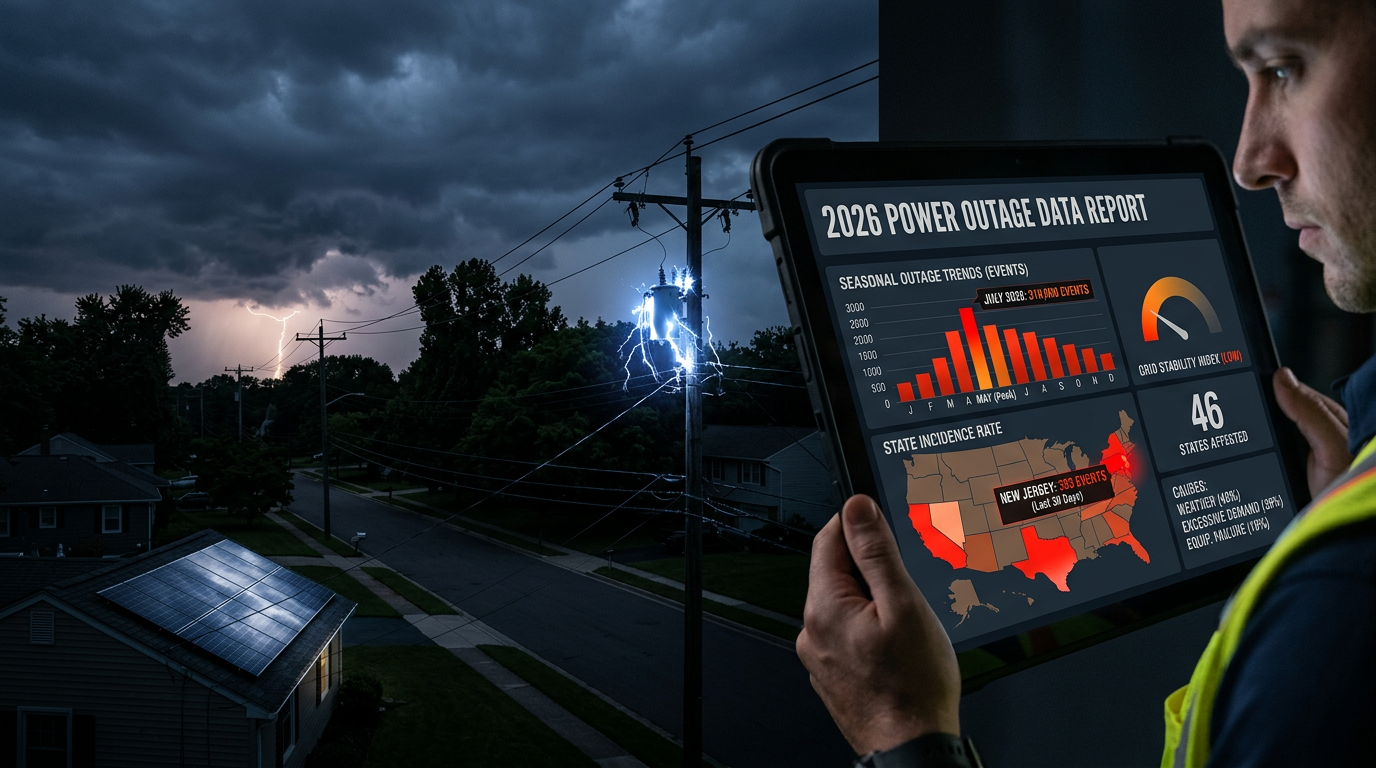
The honest answer: it depends on the state. New Jersey is running 393 outage events per county per month right now. Every one of its 21 counties had repeated outages. California hit 353 events per county with nearly 1.55 million customers affected in 30 days. These are high numbers by any measure.
National year-over-year trend data is hard to pin down because reporting standards vary by utility and coverage has changed over time. What the data does show clearly is that some states have persistent, structural grid problems that aren't getting better. Equipment failure is the top identified cause. Vegetation contact peaks every spring. The states with the worst density numbers today — New Jersey, California, Maryland, Massachusetts, Utah — are the same ones that show up in historical data year after year.
For solar and backup power sales, the trend question matters less than the current state. A county averaging 393 events per month doesn't need to be "getting worse" to be a good territory. It's already bad enough. We covered the full state-by-state density breakdown in a separate post.
When do most power outages happen?
Spring is the peak. April leads all months with 147,094 events in historical data, followed by March at 117,557. Summer months average about 25,000 events each. Winter months sit around 15,000-16,000.
That breaks a common assumption. Most people expect summer heat or winter storms to be the worst. The data says otherwise: spring storms, wind, and vegetation growth drive the highest volume by a wide margin.
Time of day matters too. Outages peak between 1:00 PM and 4:00 PM (UTC), with 33,950 events logged during the 3:00 PM hour — nearly four times the volume at 7:00 AM. Weekdays see more events than weekends: Wednesday leads with 75,735 events, while Sunday is the quietest at 50,331.
For door-knocking teams, the timing is practical. The neighborhoods losing power on a Tuesday afternoon are the ones where homeowners are most frustrated by Wednesday morning. If you're using ZIP-level outage data to plan your canvassing routes, recency matters more than totals.
Which states have the most outage activity right now?
The top five states by events per county in the last 30 days:
- New Jersey — 393 events/county, 8,254 total events, 95,195 customers affected
- California — 353 events/county, 20,478 total events, nearly 1.55 million customers affected
- Maryland — 348 events/county across just 15 counties, 12,559 customers affected
- Massachusetts — 203 events/county, 43,108 customers affected
- Utah — 189 events/county, 96,403 customers affected
Texas has the most raw events at 32,818 but they spread across 213 counties, dropping its density to 154 per county. For territory planning, density tells you more than volume. We covered why in our state-by-state grid reliability breakdown.
California stands out for customer impact: 1.55 million customers affected in 30 days, the most of any state. Pennsylvania is second at 321,652. When a California event fires, it hits an average of 76 customers. In Texas, the average is 8. Same grid, very different impact per event.
What causes most power outages?
Equipment failure is the top identified cause. Subcategories like "Upgrading Equipment" (2,747 events, 8.4 hours average restoration) and "Equipment Problems" (1,485 events, 9.1 hours average) are the longest to fix and affect the most customers per event — an average of 115 customers for equipment upgrades and 92 for equipment problems.
Vegetation contact (tree limbs hitting power lines) accounts for over 1,000 events in the last 180 days at 6 hours average restoration. Spring growth makes this worse every year between March and May. Animals, balloons, vehicles, and other unusual causes add another 1,400+ events on top.
The biggest category is "unknown": utilities reporting "under investigation" or "pending" for the majority of events. We found that 83% of all outage events go unexplained in public data, with some utilities reporting zero causes across thousands of events. Whether the grid is struggling because of aging infrastructure, deferred maintenance, or weather patterns, the utilities themselves often don't say.
What the cause data tells you as a solar or backup power installer: equipment failure and vegetation aren't going away. These are structural problems, not one-time events. A county with recurring equipment failures has aging infrastructure that will keep breaking. That's a territory worth working. We broke down the March 2026 cause data county by county.
If you want to see which ZIPs in your territory had outages this week, grab a free grid profile and we'll send you the breakdown by county, cause, and restoration time.