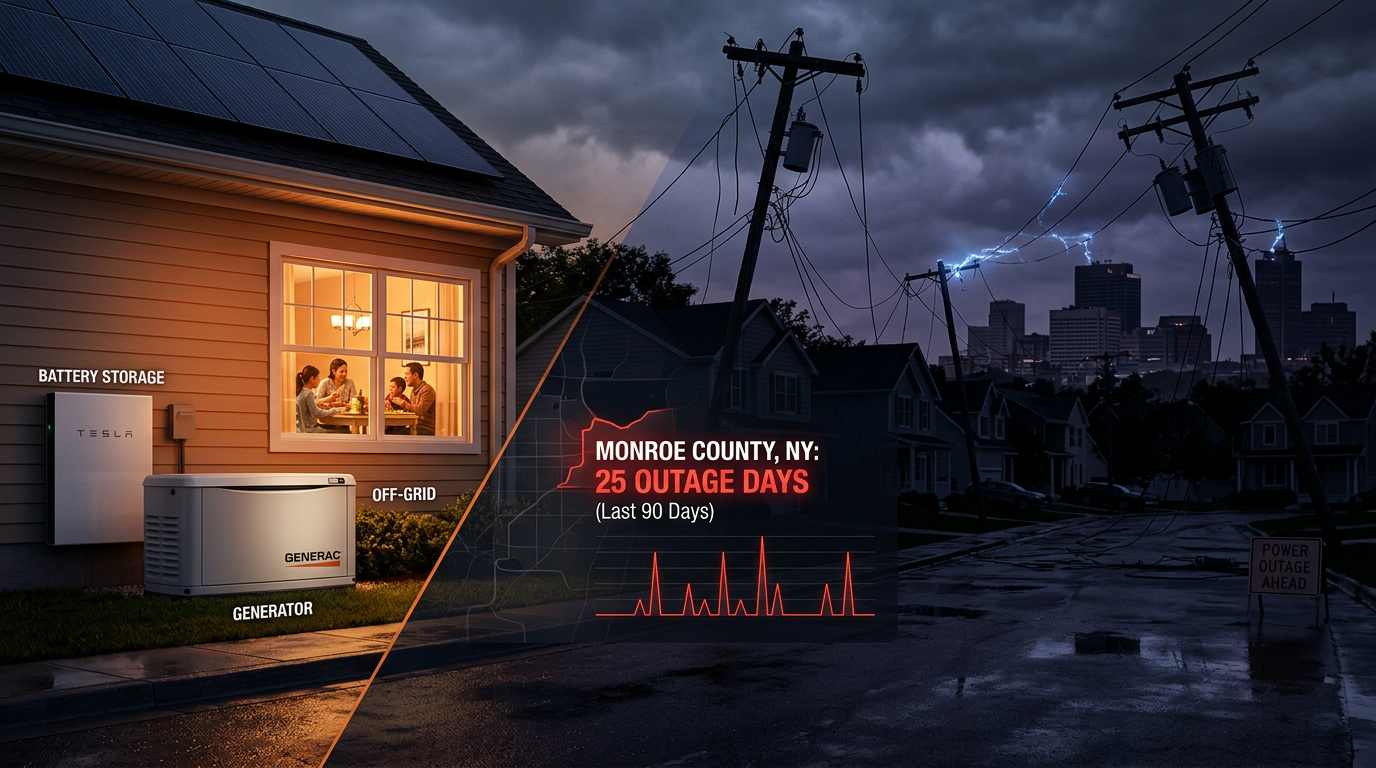
Monroe County, New York lost power on 25 of the last 90 days. Erie County: also 25. King County, Washington: 24. Pierce County, Washington: 24. These aren't storm zones recovering from a single event. These are counties where the grid fails multiple times a week, month after month. Every one of those outage days is a homeowner thinking about backup power. (Over a 12-month window, the chronic-county leaderboard shifts toward California and Texas — same metric, different lens.)
The same outage data that solar installers use to pick territories works for generator dealers and battery installers. The signals are just slightly different.
Where is demand highest for whole-home generators?
Counties with long, infrequent outages are the best generator territories. When power stays out for 8, 12, or 50 hours, a battery alone can't keep a house running. That's where whole-home generators sell.
New York is the top generator market in the country right now. The state averages 49.7 hours to restore power — five times the national median. Monroe County had outages on 25 of the last 90 days. Erie County logged 520 events in the same window, with single events hitting 2,345 customers. Sullivan County, Ulster County, Saratoga County, and Dutchess County each had outages on 23-24 of 90 days.
Other strong generator territories by restoration time:
- Puerto Rico — 13.0 hours average restoration, with a 90th-percentile of 30.6 hours. One in ten outages lasts more than a full day.
- Nevada — 12.8 hours average, 90th-percentile at 22.4 hours.
- New Hampshire — 11.9 hours average across 311 events. Rural grid, long repair drives.
- Oregon — 7.4 hours average across 5,595 events. Jackson County alone had outages on 23 of 90 days with events hitting up to 1,917 customers.
A homeowner who sat in the dark for 12 hours last Tuesday doesn't need a pitch. They need a quote.
Which areas need home battery storage most?
Dense, high-rate markets with frequent short outages are the best battery territories. A 10-kWh battery covers a typical home for 4-6 hours. If outages in a county rarely exceed that window, batteries are the right product.
New Jersey leads with 393 outage events per county per month — the highest density in the country — but average restoration is under 4 hours. That's a battery market, not a generator market. All 21 counties had outages. At 27.6 cents/kWh in counties like Atlantic and Cape May, the economics work for daily rate arbitrage on top of backup.
Maryland had 348 events per county across just 15 counties with an average restoration of 4.6 hours. Massachusetts hit 203 events per county, with Essex County logging outages on 23 of 30 days. Both states have restoration times that fit inside a battery's runtime and electricity rates high enough to justify the install on savings alone.
California is the hybrid case: 353 events per county, 36.2 cents/kWh rates, but a 90th-percentile restoration of 12.1 hours. That long tail means some customers need batteries for the typical 3-hour flicker, and some need a generator for the 12-hour events. Counties like Contra Costa (791 events, 65.7% owner-occupied) and Alameda (992 events, 51.1% owner-occupied) have enough volume to support both product lines.
How do generator dealers use power outage data?
Generator dealers use outage data to find the counties where backup power isn't a luxury — it's the next purchase a homeowner makes after a bad week.
Three data points separate a productive territory from a dead one:
- Restoration time — States averaging 8+ hours per outage are generator territory. New York (49.7 hours), Nevada (12.8 hours), and New Hampshire (11.9 hours) top the list. We covered the full state-by-state grid breakdown with density scores for every state.
- Chronic outage days — A county with outages on 20+ of the last 90 days has homeowners who've already decided they need backup. They're comparing options, not debating whether to buy. Monroe and Erie counties in New York, King and Pierce counties in Washington, and East Baton Rouge Parish in Louisiana all hit 23-25 outage days in 90.
- Single-family home density — Generators go on pads next to houses. A county with 70% single-family homes is a better install market than one with 40% apartments. Census table B25024 breaks this down by ZIP. We explain how to filter ZIPs by housing type for territory planning.
Generator dealers who wait for inbound calls after a storm are competing with every other dealer in the region. Dealers who prospect the ZIPs that lost power last week, before the next storm hits, close faster and compete with fewer quotes.
What's the difference between battery and generator territories?
Battery territories have frequent, short outages and high electricity rates. Generator territories have infrequent, long outages and rural housing.
Here's how the same data splits into two different product markets:
Battery territory signals: - Outages averaging under 4 hours to restore - High events-per-county density (200+ per month) - Electricity rates above 20 cents/kWh (rate arbitrage adds ROI beyond backup) - Dense suburban housing with high owner-occupancy
Generator territory signals: - Outages averaging 8+ hours to restore - Lower event density but higher impact per event - Rural or exurban housing with larger lots (room for a pad and gas line) - Limited grid redundancy (single utility, long repair drives)
Some markets are both. Louisiana had 10,632 events across 60 parishes in 90 days — that's high frequency — but East Baton Rouge Parish had outages on 23 of 90 days and events hitting 730 customers at once. The short outages sell batteries. The long ones sell generators. A dealer who carries both can sort their pipeline by ZIP-level restoration times. We covered where to find power outages by ZIP for installers who want to source this themselves.
Washington is similar. King County had outages on 24 of 90 days with events reaching 7,090 customers. Pierce County hit 7,686 customers in a single event. Urban King County ZIPs with 3-hour outages are battery territory. Rural Pierce County ZIPs with 10-hour outages are generator territory. Same county-level data, different product for different ZIPs.
Can the same outage data work for solar, generators, and batteries?
Yes. The underlying data is the same — grid events, restoration times, customer counts, housing type, electricity rates. What changes is which columns you sort by.
Solar installers sort by event count + electricity rates + single-family %. A ZIP with frequent outages, high rates, and detached homes is a solar pitch. Battery installers sort by event frequency + short restoration + high rates. Generator dealers sort by long restoration + chronic outage days + rural housing.
GridProfile pulls from the same government sources for all three — ODIN, EAGLE-I, Census, and EIA rate data — and stitches them together at the ZIP level. The solar installer and the generator dealer looking at Harris County, Texas see the same 4,997 events across 3 utilities. The solar installer targets the suburban ZIPs with high rates and short outages. The generator dealer targets the exurban ZIPs with long restoration times and big lots. The March 2026 data shows both patterns county by county.
The backup power market is growing because the grid isn't getting more reliable. Counties that had outages on 20+ days in the last 90 aren't going to suddenly stop. If you sell generators, batteries, or solar, the same outage data tells you where your next customer lives. Grab a free grid profile to see the ZIP-level breakdown for your counties.