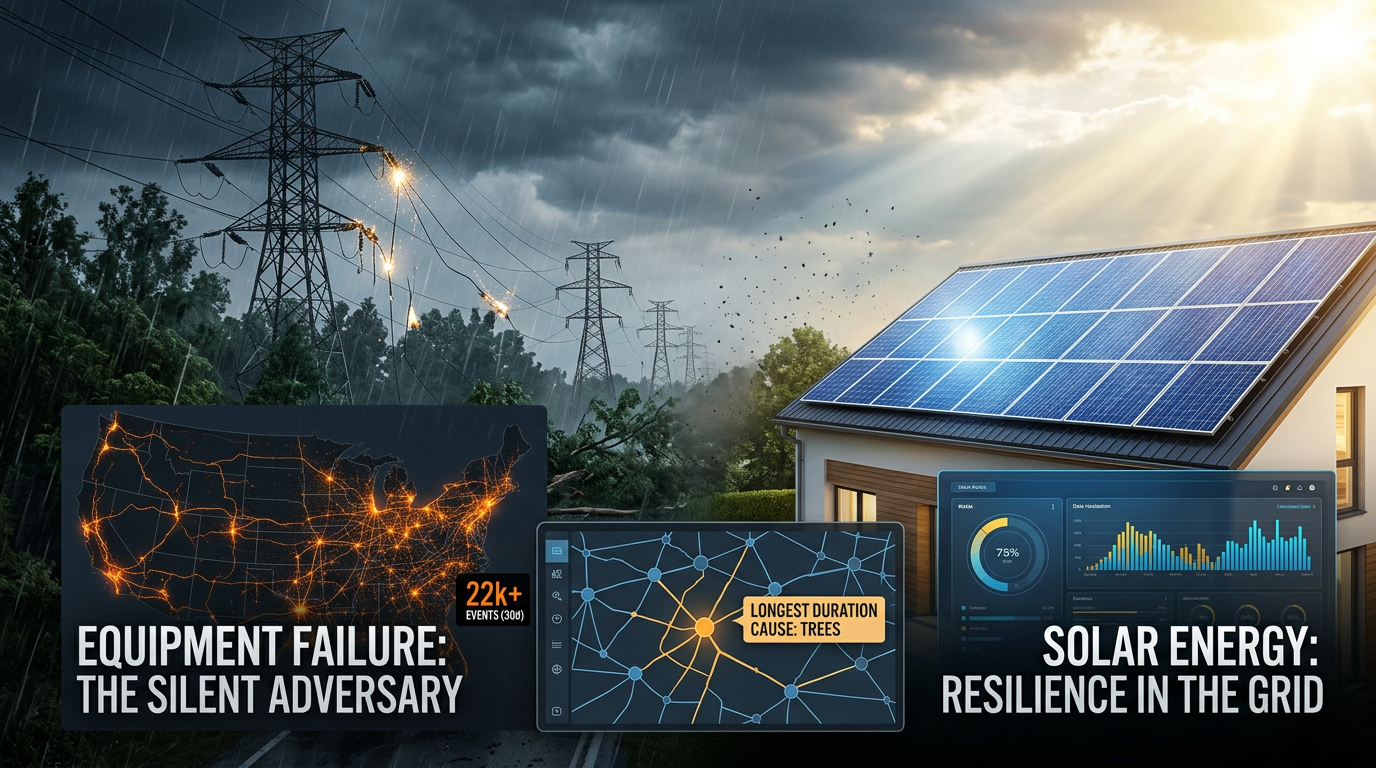
Equipment failure caused more than 22,000 power outage events across the U.S. in the last 30 days. Storms and severe weather caused about 6,700. The aging-grid story most installers already half-believe is sitting in the data, and it's bigger than weather by more than 3-to-1.
If you run a solar, battery, or generator sales team, that cause mix is raw pitch material. The follow-up is more interesting: the cause that keeps the power off longest isn't equipment failure or storms. It's the trees.
What is the leading cause of power outages in the US?
Equipment failure. Across the last 30 days of utility-reported grid events, equipment-related causes drove more than 22,000 outage events, roughly 3.5 times the volume of every weather and storm category combined.
The mix breaks down by sub-category:
- Equipment Problems: averaged 9.5 hours to restore, 101 customers per event (1,766 events)
- Upgrading Equipment (proactive replacements where power stays out): 9.7 hours, 104 customers (3,116 events)
- Pole Upgrade (pole replacements): 10.7 hours, 79 customers (954 events)
- Equipment Failure (the explicit label): 7.5 hours, 44 customers (1,199 events)
- Damaged Equipment: 9.6 hours, 29 customers (701 events)
These aren't the dramatic, telegenic outages that lead the news. They're the slow grind of a grid that needs more replacement than it's getting. One pole goes down, 100 customers lose power for nine hours, the utility sends a single crew, and nobody outside the affected ZIP knows it happened.
Are storms the main cause of power outages?
No. Across the same 30 days, weather-related causes (Storm Damage, Severe Weather, Weather Related) totaled roughly 6,700 events. Equipment failure outpaced them by more than 3-to-1.
Storms are more visible. A single severe-weather front can knock out tens of thousands of customers in one event and dominate the news cycle. Storm Damage events averaged 56 customers per event in the data, much higher than equipment-failure events. So when storms hit, they hit hard.
But over a year, the equipment failures add up. Roughly 89% of US outage events with an identified cause are equipment-related, not weather-related. If your mental model of grid reliability is "the weather got bad," you're missing the bigger chunk of the data.
Which cause keeps the power off longest?
Vegetation contact. When a tree takes down a line, restoration averages 11 to 12 hours in the worst sub-categories. The data label "Trees" averaged 12.5 hours per event across 1,159 events in 30 days. "Damage from tree" averaged 11.0 hours. Even the cleaner sub-categories ("Vegetation" and "03 Vegetation") average 6 to 7 hours, longer than typical equipment or weather restoration.
Why it lasts: a fallen tree usually means a snapped span of wire, not a blown fuse. Crews have to clear the tree, replace the conductor, sometimes reset a transformer, and re-energize. Half-day outages aren't unusual.
The pattern is regional. In Michigan, where ice loads and heavy canopy combine, vegetation-caused outages average over 12 hours, among the longest in the country. New Hampshire averages 20.5 hours per outage state-wide. New York averages 15.3 hours across more than 14,000 events.
The implication for solar + battery sales is direct. A 30-minute outage barely registers with a homeowner. A 12-hour outage rearranges their week.
Why don't utilities explain most outages?
They mostly don't. 83% of all U.S. outage events in recent data have no identified cause in public feeds: the utility logged the outage but left the cause field blank, "Pending Investigation," or "PATROLLING." Only about 17% of events carry a real explanation.
The cause numbers above describe a slice of the data: the slice that's actually labeled. The full picture, including the unexplained majority, is in our breakdown of why utilities don't report cause data. Some utilities (Southern California Edison, Consumers Energy) report causes for nearly every event. Others (Entergy, Georgia Power, Alabama Power) don't include a cause field in their public APIs at all. The cause data is partial because the reporting is partial.
What does this mean for solar and battery sales?
It changes both which counties are worth working and which outages are worth pitching against.
The equipment-failure majority means the weakest grids aren't always in storm-prone states. Counties with high event counts and high equipment-failure rates have utilities running infrastructure past its useful life. That risk is year-round, not seasonal. A county that gets 200 equipment-related events a quarter has the same exposure in calm weather as in storm season.
Vegetation duration is where battery storage justifies itself. A homeowner who lost power for 30 minutes shrugs and forgets. A homeowner who lost power for 12 hours starts comparing battery brands. The strange causes we covered separately (squirrels, balloons, vehicles into poles) get the headlines, but vegetation has the longest tail and the strongest pitch hook.
The three pieces of outage data an installer should actually pull from a territory:
- Frequency: how often the grid breaks in a given ZIP, regardless of cause
- Duration: average restoration hours, which separates inconvenience from frustration
- Cause mix: when available, whether the problem is structural (equipment) or seasonal (vegetation, weather)
The GridProfile reports give all three at the ZIP level. Sort by recent events to find where the grid just broke. Sort by repair hours to find where the homeowner sat in the dark long enough to listen.